Manual
Alarm
Burst Data
Dashboard
Data Source
Manual Inclinometer
Loadsensing
Ackcio
CSI
File Import
Geokon
SAA
Sigicom
Total Stations
Waste Management
Profound
Axilog
GSS
Webcam import
Displacement Graph
GIS
Historical Graphs
Real Time Display
Virtual Variables
SSO
Setup Azure AD for VDV
Setup Single Sign-On in VDV
Single Sign-On setup checklist
Manual provider setup
Analysis
API
Contacts
Contact Groups
Completeness
Data Export Task
Documents
Download Data
Localization
Notes
Month Overview
Reports
Site Setup
QA/QC
Project
Prism
Update Overview
Users in VDV
Manual Import
Setting up a webcam
Embed API
Webcam
User interface
License Overview
Graph Configuration
Site Map
Quick View
Videos
Guides
After install action list
Install VDV on-premise
Creating a new project
Installing scheduled tasks
Restarting the Vista Data Vision System
Exporting site and unit lists from db.robot.c
Exporting the settings from the File Converter
Muting sounds in VDV
Updating VDV with the store in offline mode
Migrate/Move Vista Data Vision to a new server
FAQ
Server Side
File Converter gets empty
Update header - new sensors added to the data file
Import modified or historical data
The VI Not Executable
Email subject contains information from the mail server
Webcam not importing pictures
How to configure Text Message Service
Run tasks minimized
Units
System Requirements
Backing up VDV
Front end
How to extend VDV Timeout
System validation after PHP 8 update
- All Categories
- Manual
- GIS
- View GIS
View GIS
Updated
by Ragnar Tryggvason
To Access: Go to Menu -> GIS.
GIS Menu
In the top-right corner, users can choose different options.

- Markers: List of all markers on the GIS. It's straightforward to filter out specific markers.
- Layers: List of all layers on the GIS. Simple to show/hide specific layers.
- Tools: Optional tools. Measure distance, take a snapshot, create a Contour plot and Show labels.
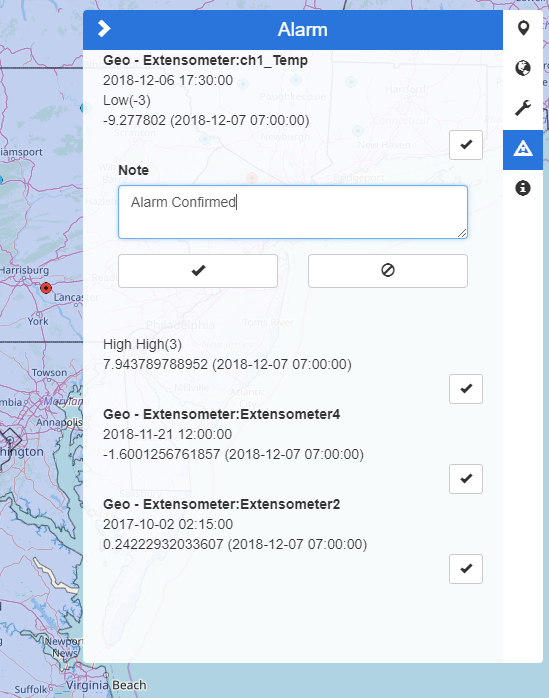
- Alarms: List of all Alarms.
- Information: GIS Description, which is added in the GIS setup.
Markers
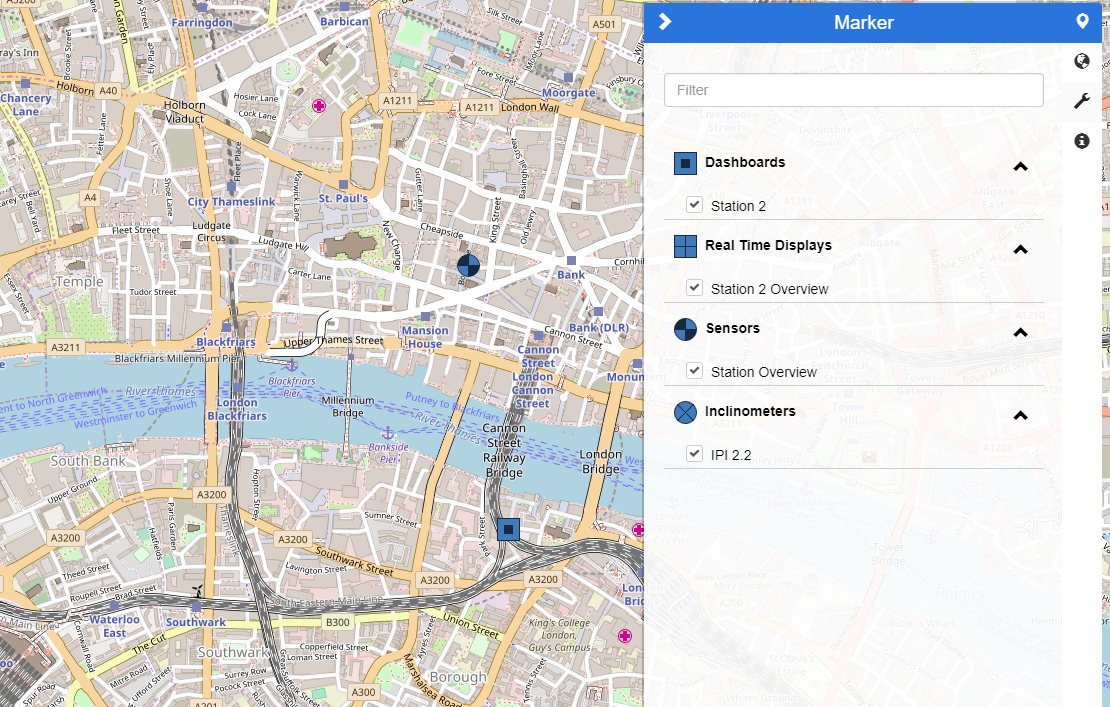
When the Marker icon is clicked, a list of all Markers will be shown.
- It's straightforward to use the Filter to search for a specific marker.
- Click on the Icon of each Marker Type to Hide/Show all markers.
- Click on any Marker name to show the data.
Layers
Hide/Show GIS Layers.
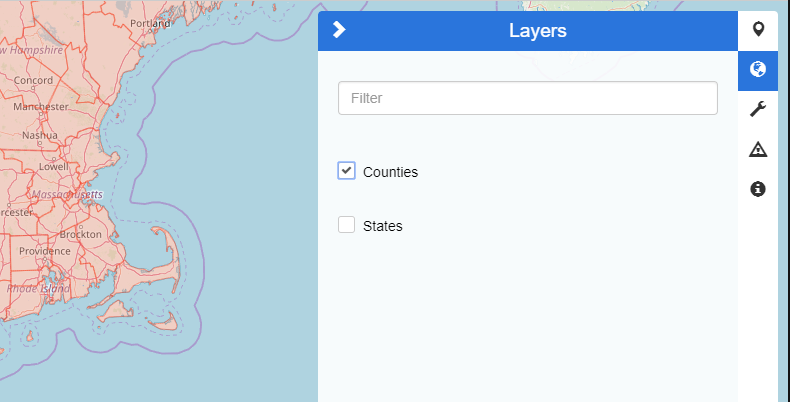
If a Layer has been configured to allow Layer information, users can click on a layer to show the Layer information.

Tools
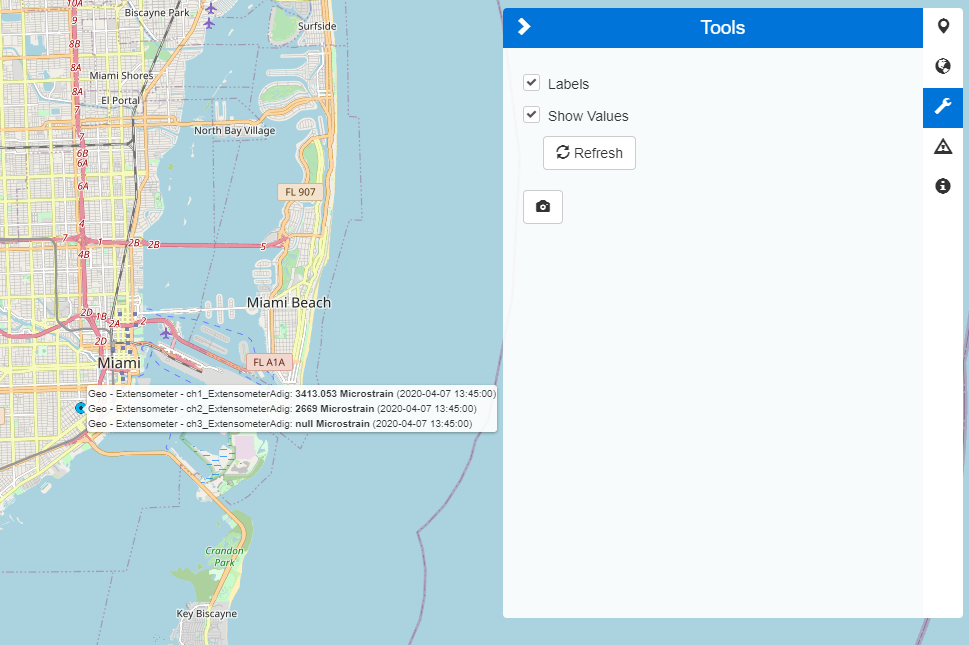
Labels: If activated, the Label of each marker will be shown. Values can also be shown.
Snapshot: If the user clicks on the Snapshot button  , a screenshot of the GIS will be saved to the user's computer.
Measurement: the Measurement button  will appear on the left-hand side of the screen, and with it, users can measure the distance between two or multiple points.
Select sensors
 icon, then the user can circle the markers he wishes to choose.
After selecting the user can
- Click on the View button to view a graph with all the selected variables.
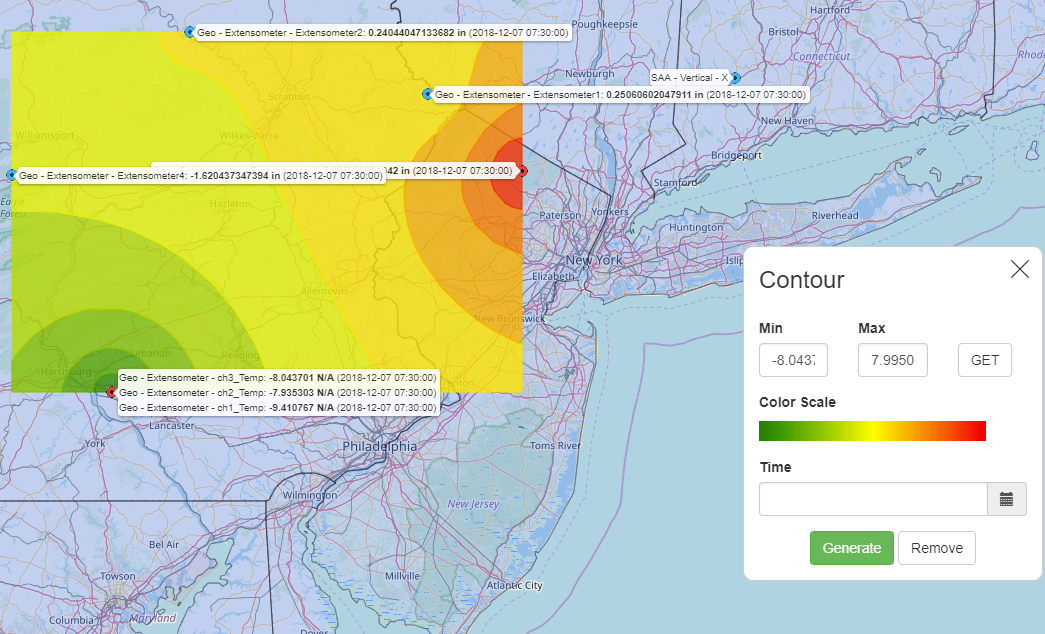
- Click on the Contour to create a custom Contour plot for selected variables.
- Choose Min, Max and Click Generate.
Prisms
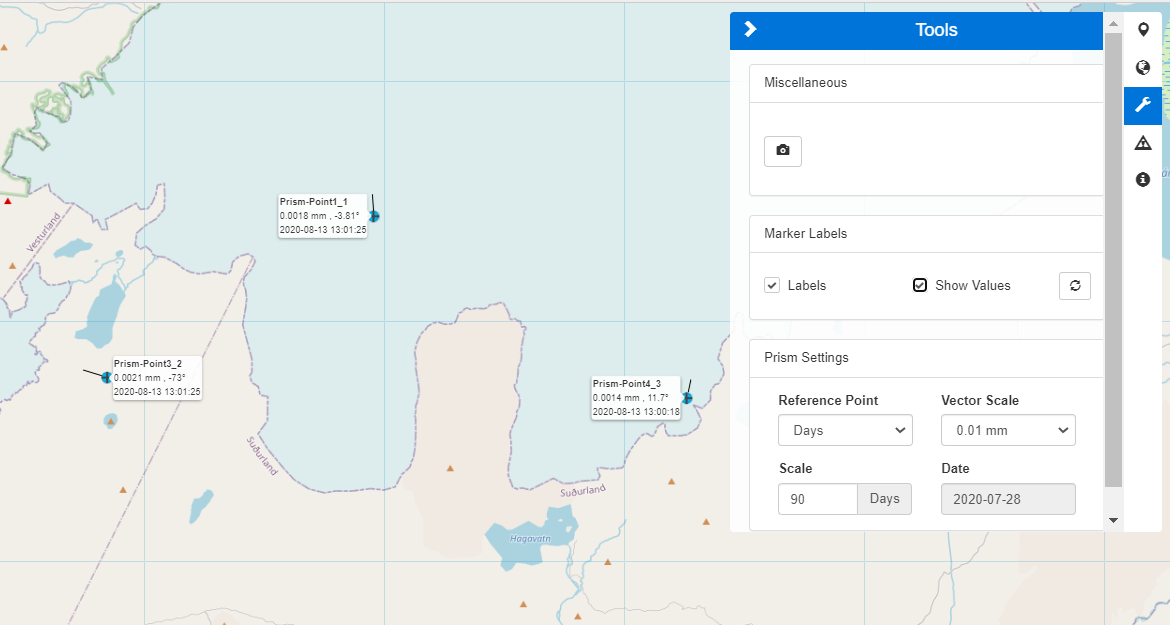
The Prism settings allow the user to select the Reference Point (Days/Date), Vector Scale, Scale (if Days are chosen), or Date (if Date is chosen).
Alarms
A list of all alarms on the GIS map will be shown in a list on the right. The alarms can also be confirmed from there.