Table of Contents
Create Virtual Variables
Updated
by Ragnar Tryggvason
Virtual variables are used to create new calculated variables that are a mathematical function of one or more sensor readings. Virtual Variables can be used as any other sensor in the system. Add it to a plot and configure for an alarm.
Configure Virtual Variables (VV)
Go to Setup > Virtual Variable.
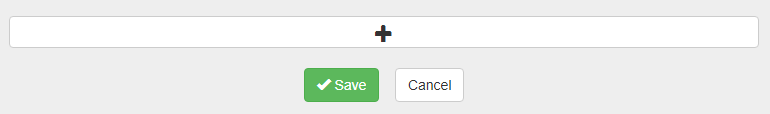
Click + button in the top right corner to create a new VV.
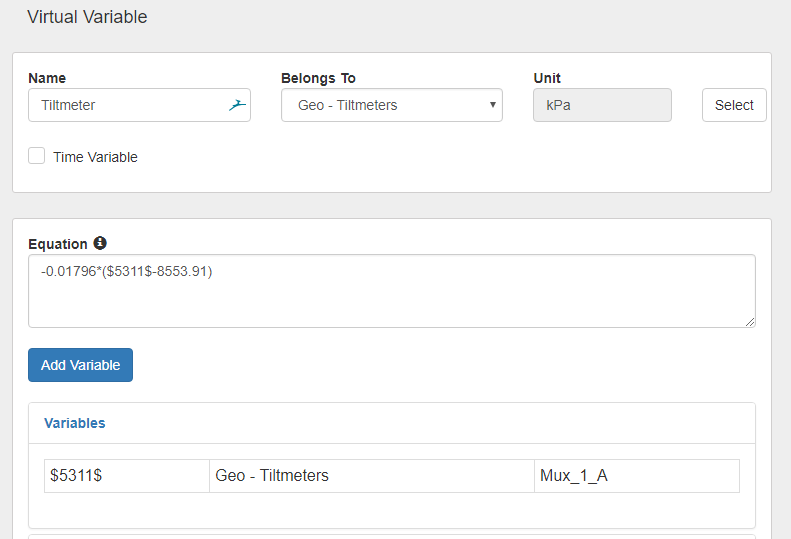
- Select the Site and Variable to include in the formula. Double click it to add it to the Equation window.
- It is possible to select Variables from different Sites into the same Equation
Here is a basic sensor calibration Equation. Notice the $1612$ which is the Variable ID. All variables in the equation will be listed in the Variable table.
Match Timestamps
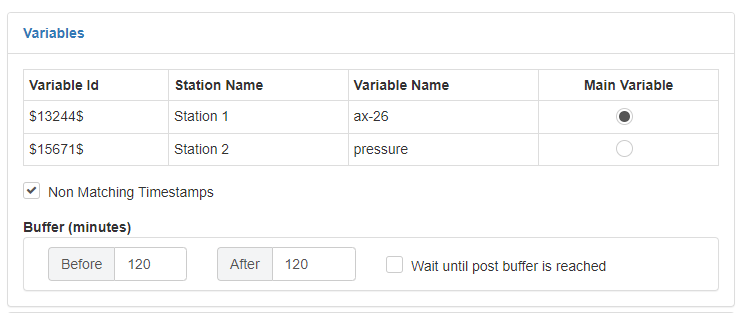
When the Virtual Variable Equation includes variables from more than one Site and they have different logging periods the Non-Matching Timestamps option can be selected.
When the option is selected the following controls become available:
- Main Variable - The selected Main Variable values will be used as a reference when calculating the formula
- Before/After Buffer - Decide how far to search from each timestamp of the Main Variable.
- Wait until post buffer is reached - If this option is selected, the calculations will wait until the timestamp of the post buffer is reached to return a value.
Match Timestamp Calculation Example
The following variables are being used in an equation
Sensor | Sensor Update Rate | Sensor update time (HH:MM) |
A | Hourly | HH:56 |
B | Hourly | HH:31 |
C | 15 Minutes | HH:00, HH:15, HH:30, HH:45 |
Scenario 1.
Equation | Main Variable | Pre Buffer | Post Buffer |
A + C | Sensor C | 30 min | 30 min |
The VV calculates the formula at 15 minute intervals where the C uses its own data and looks for data in A 30 minutes before and 30 minutes after.
Scenario 2.
Equation | Main Variable | Pre Buffer | Post Buffer |
A + B + C | Sensor A | 30 min | 5 min |
The VV calculates the formula hourly with the timestamp as HH:56.
A uses its own data and looks for data in C and B 30 minutes before and 5 minutes after. This means that at HH:56 if it does not find data for both B and C in the range 30 minutes before and 5 minutes after it will not return anything. However as B has updates at HH:31 and C at HH:00 this scenario will return value.
Note that it would have found data for C at HH:00, HH:30 and HH:45. It would use the HH:00 measurement as that is the closest one.
Scenario 3.
Equation | Main Variable | Pre Buffer | Post Buffer |
A + B + C | Sensor C | 25 min | 20 min |
The VV calculates the formula at 15 minute intervals.
At HH:00 the buffer doesn't reach Sensor B so no reading will be returned there.
At HH:15 the buffer finds values from both A and B and returns normal values
At HH:30 the buffer doesn't reach Sensor A so no reading will be returned there.
At HH:45 the buffer finds values from both A and B and returns normal values
Wait until post buffer is reached
If this option is selected, the calculations will wait until the timestamp of the post buffer is reached to return a value.
Example:
If the current time is 08:53 and the post buffer is set to 10 minutes from the main variable which updates every hour the calculation will not be made until the post buffer timestamp is reached even though the prebuffer finds a valid timestamp.
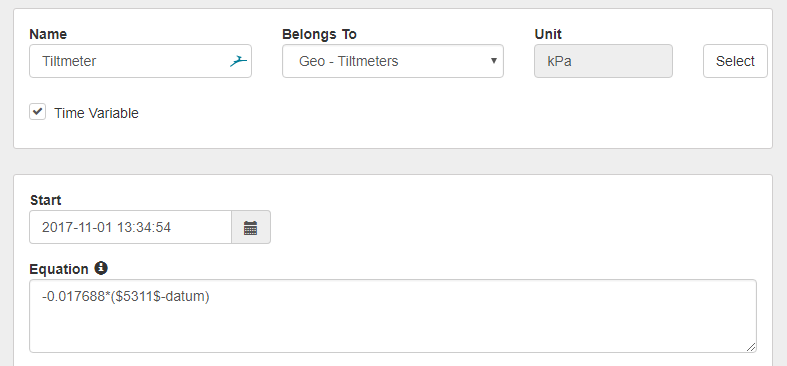
Time Variable
It is possible to have a different formula for different time period. This is useful if the sensor has been replaced or re-calibrated and a new formula is needed.
Check the Time Variable checkbox to activate the Time variable. A date picker appears above the equation to select the data when this formula starts.
To add a new time period click the + button below the first equation calculation example.
VV Constants
It is simple to add constants into the Equation to make it easier to manage and read.
Expand the Constant section and add a new constant. It is possible to add multiple constants.
Rate of Change
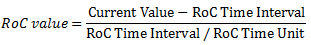
The rate of change is used to calculate how fast a sensor value changes. This is useful to indicate a flood or a landslide or any sudden movement that is otherwise hard to detect. RoC for a sensor value may be plotted just like the sensor value itself.
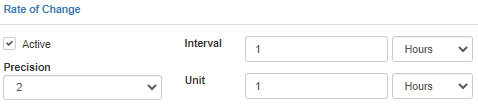
The Precision is selected in the drop down menu and indicates the numerical precision of the results.
The Interval can be in minutes, hours or days, RoC is calculated for this time interval
The Unit can be in seconds, minutes, hours or days. The RoC unit allows the user to plot the average difference for specific units for the RoC.
VV Datum
Often there is a need to use a baseline reading in the equation. The Datum feature is useful for this purpose.
Expand the Datum Section and click Select.
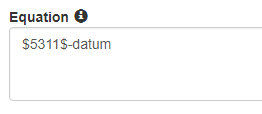
Select Site, Variable and Timestamp for the Datum Reading. VDV will automatically select the oldest reading in the database. Click Select to select the Datum value.

Now we can change the baseline reading (8553.91) and simply type in datum. When the Datum reading is changed the formula is updated at once.
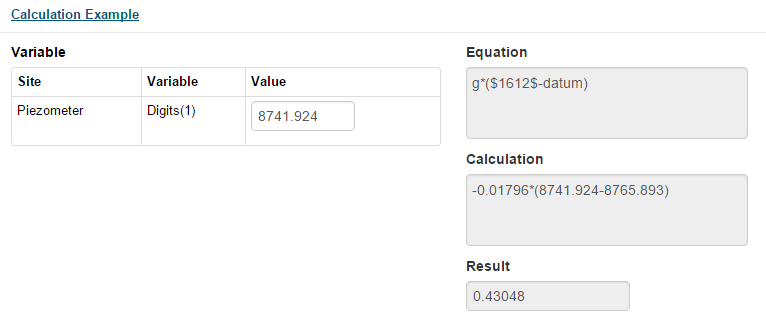
Calculation Example
When a VV has been created it is a good practice to make sure it is working properly.
Expand the Calculation Example section.
Change the Value for each Variable in the equation and see how the result changes.