Table of Contents
QA/QC
QA/QC is a great quilty tool now available as an add on feature in VDV, it allows Users to audit data that has been assigned to an active QA/QC site. What makes this tool superior to direct edit of the data is that it allows for data editing and flagging of the data without it affecting the raw data.
What this does is that it allows for better and clearer data presentation where the user can choose to present only the relevant QA/QC level, where the data has been audited rather than presenting data that is not relevant or correct to the viewer.
Configuring
Site Setup
On the right side menu in VDV navigate to the QA/QC icon 
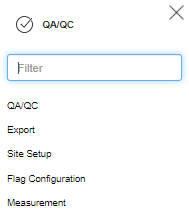
Go to Site setup to set up a QA/QC Site
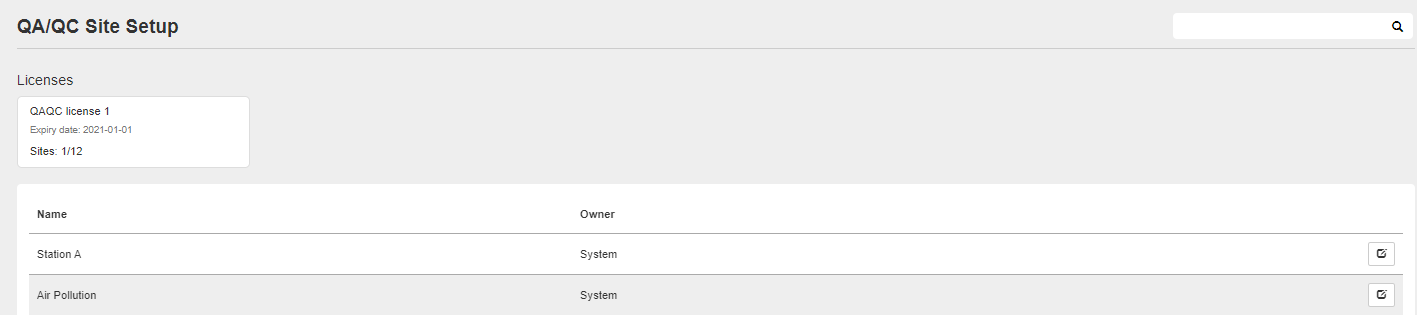
Click on the edit button to make the site a QA/QC site.
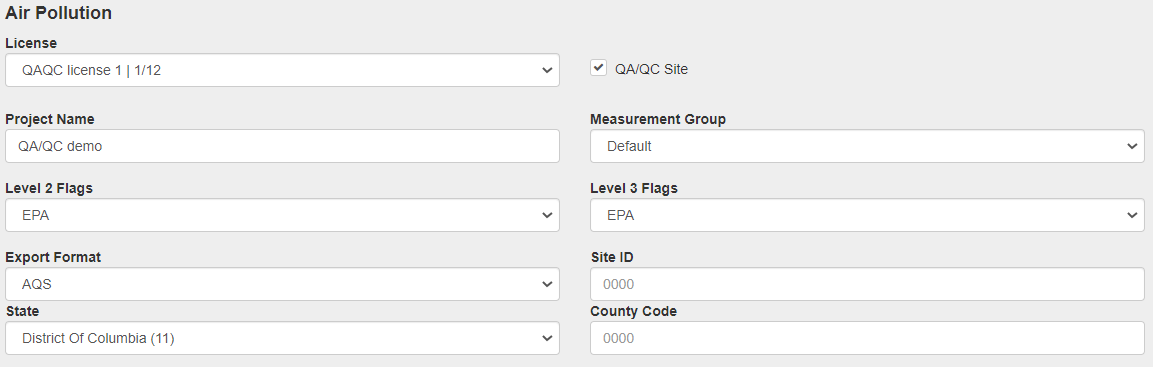
Select the license from the drop-down menu, and mark the site as a QA/QC site, fill in Project name, Measurement group, Level 2 and 3 flags, Export Format and State, Site ID, and Country Code.
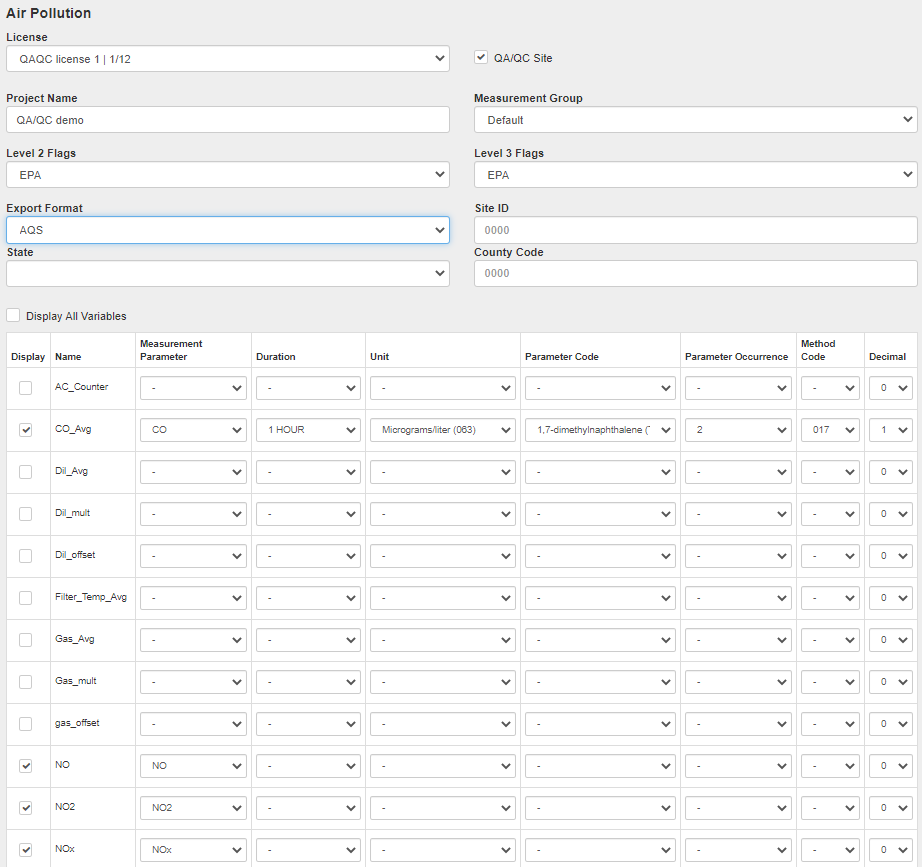
Depending on the export format chosen the user can select other parameters such as Duration, Unit, Parameter Code, Parameter Occurance, Method Code, and Decimal for each Variable.
It is also possible to choose between displaying all variables or selecting just the once the user is interested in assigning to the QA/QC site.
QA/QC
QA/QC stations can be audited through the QA/QC tab on the left-hand side menu in VDV. When auditing a station the user can select which level to audit and he can choose from either manual or bulk edit.
Manual Edit
Manual Edit lets the user correct the data manually, select at least one cell for one or more variables. The manual correction can be made statically or time-varying. Fill out the slope and offset value and apply the correction to the values.
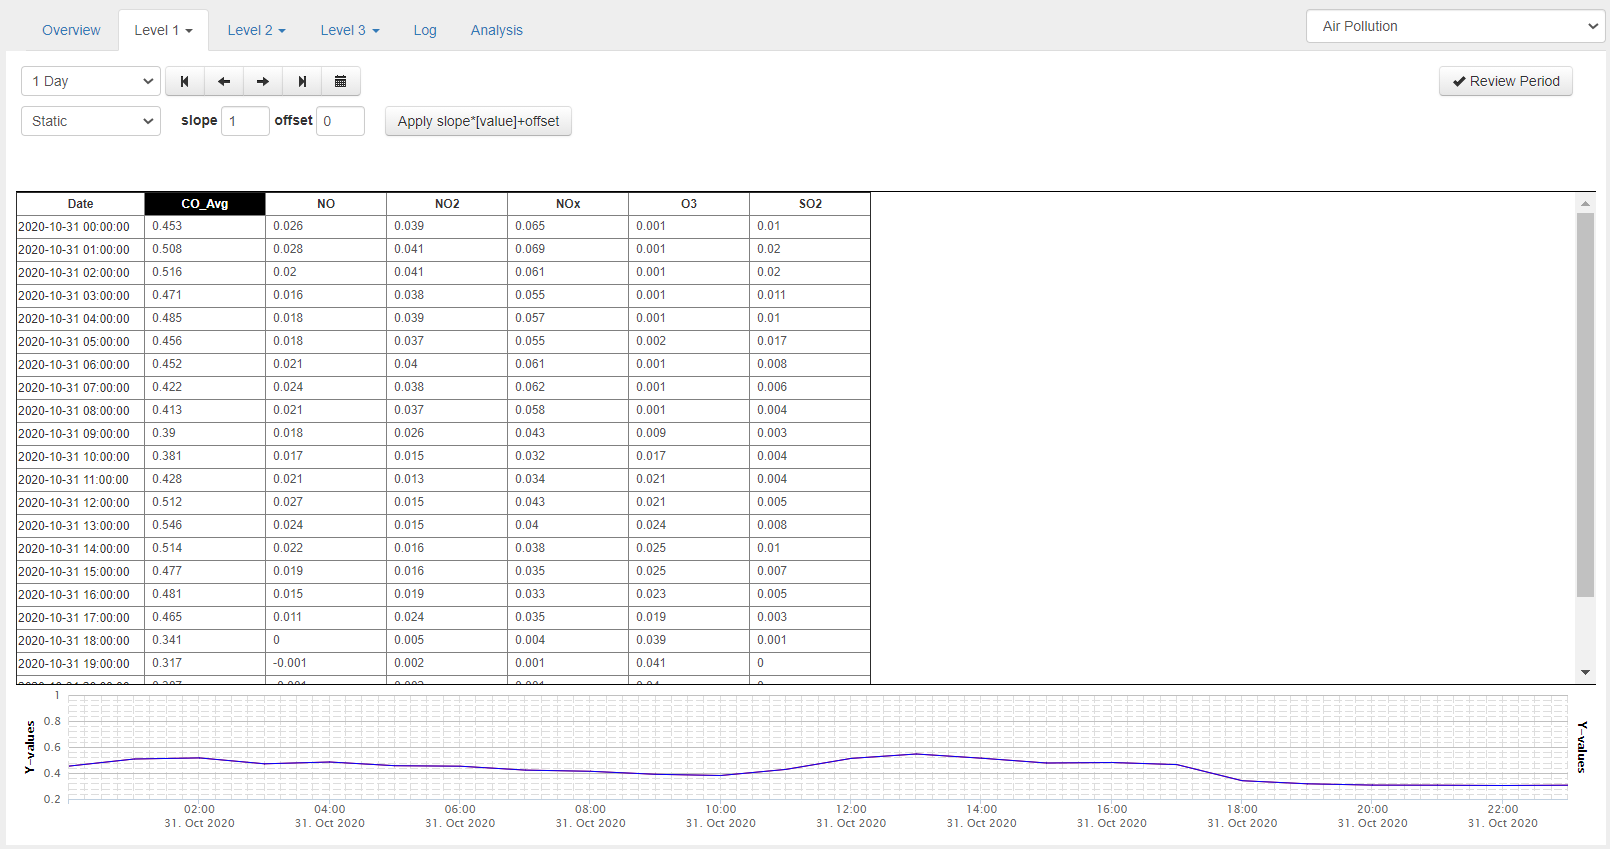
To select what variable to display on the graph below, click on the header of that variable (here CO2).
To audit a variable select the data by clicking on the databox, before applying the correction the boxes will appear blue.
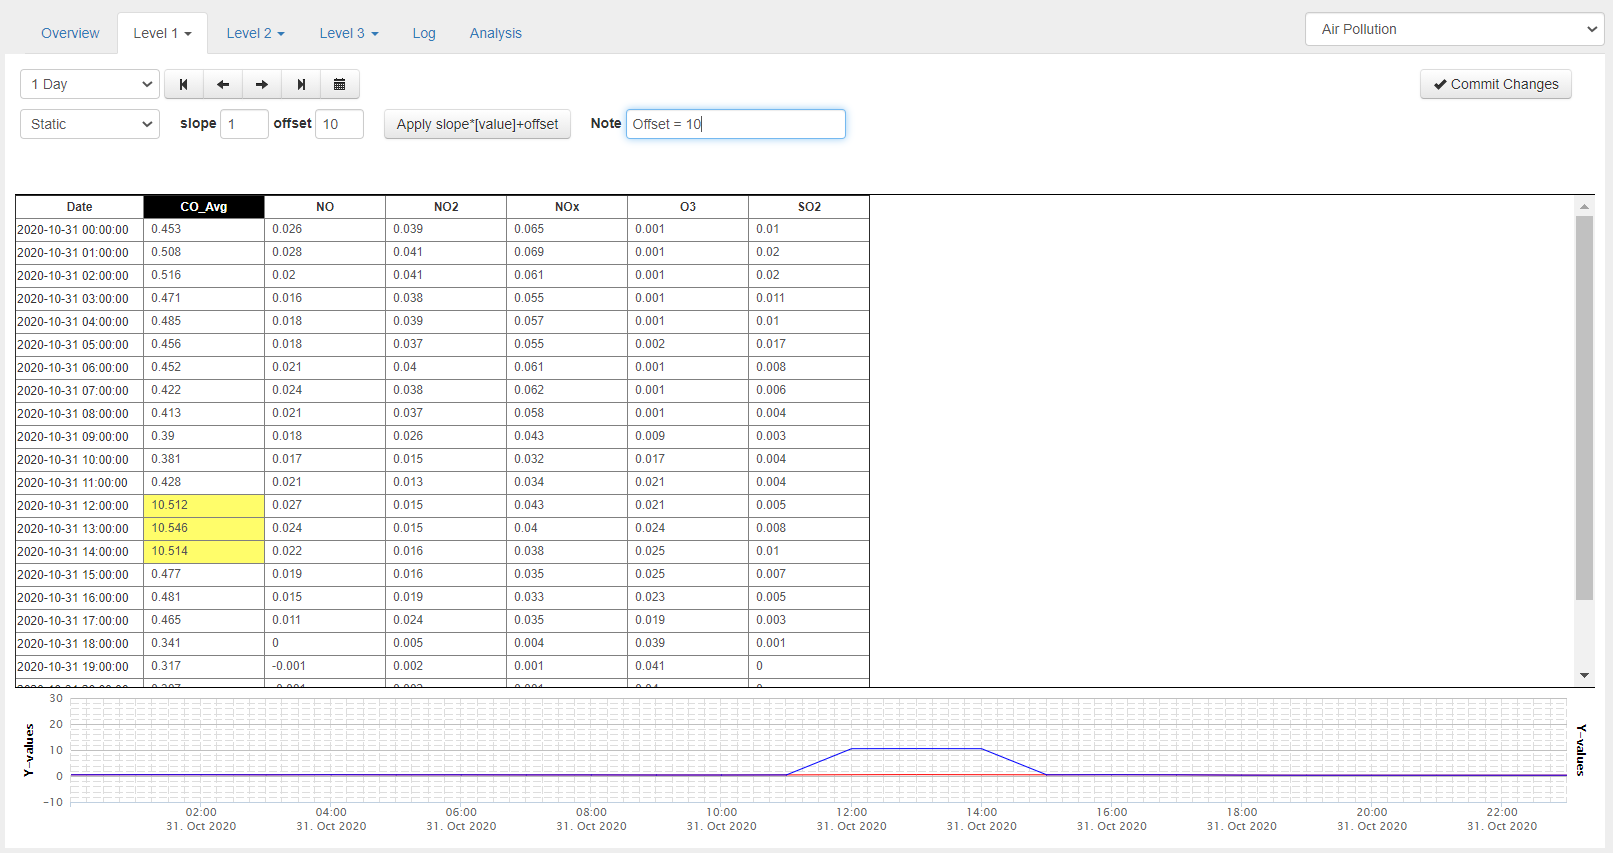
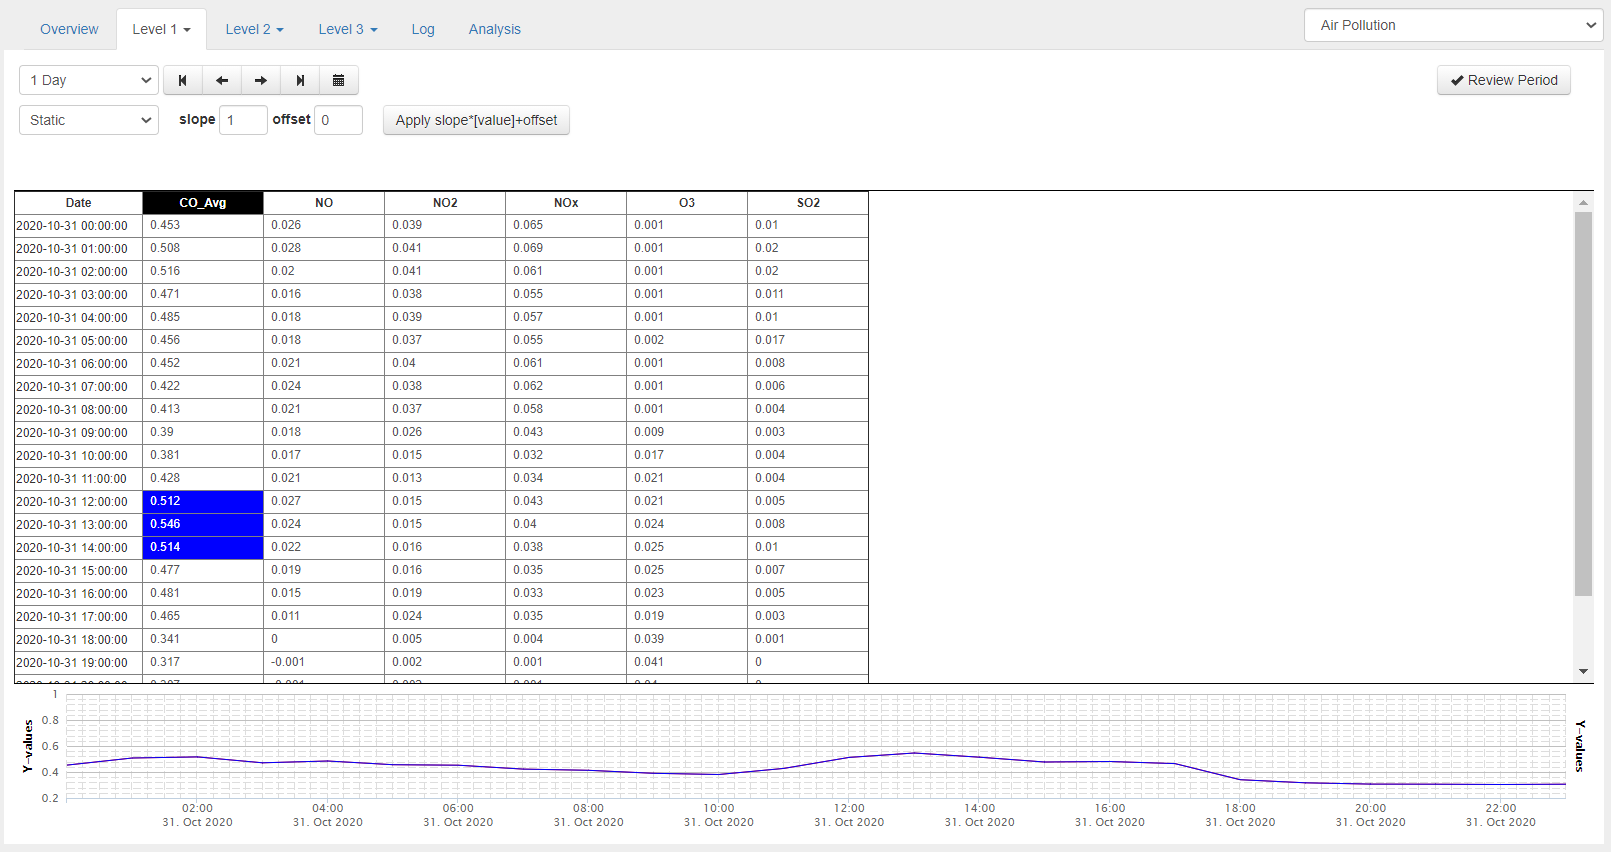
Once the Correction/Flag has been applied the boxes should show yellow and the correction (in level 1) should show on the graph below.
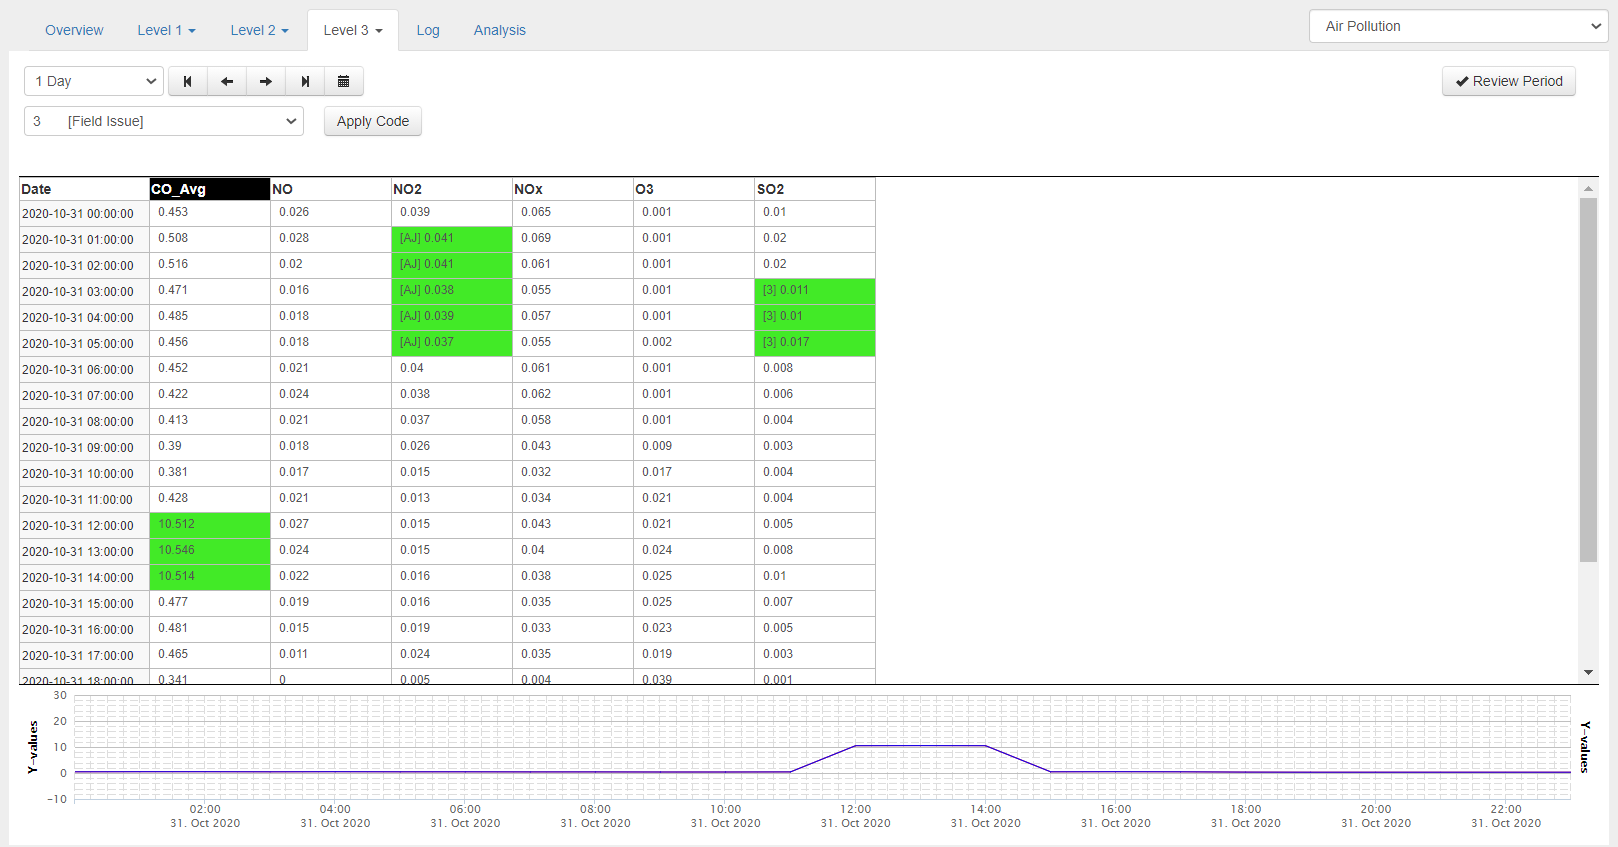
Once the Correction/Flag has been committed the data box should be green to show the user what value has been corrected, the abbreviation for the Flags placed (in level 2 and 3) will also show next to the value.

It is possible to revert the correction/flag placed by selecting the same databox again (making it blue again) and select Remove.
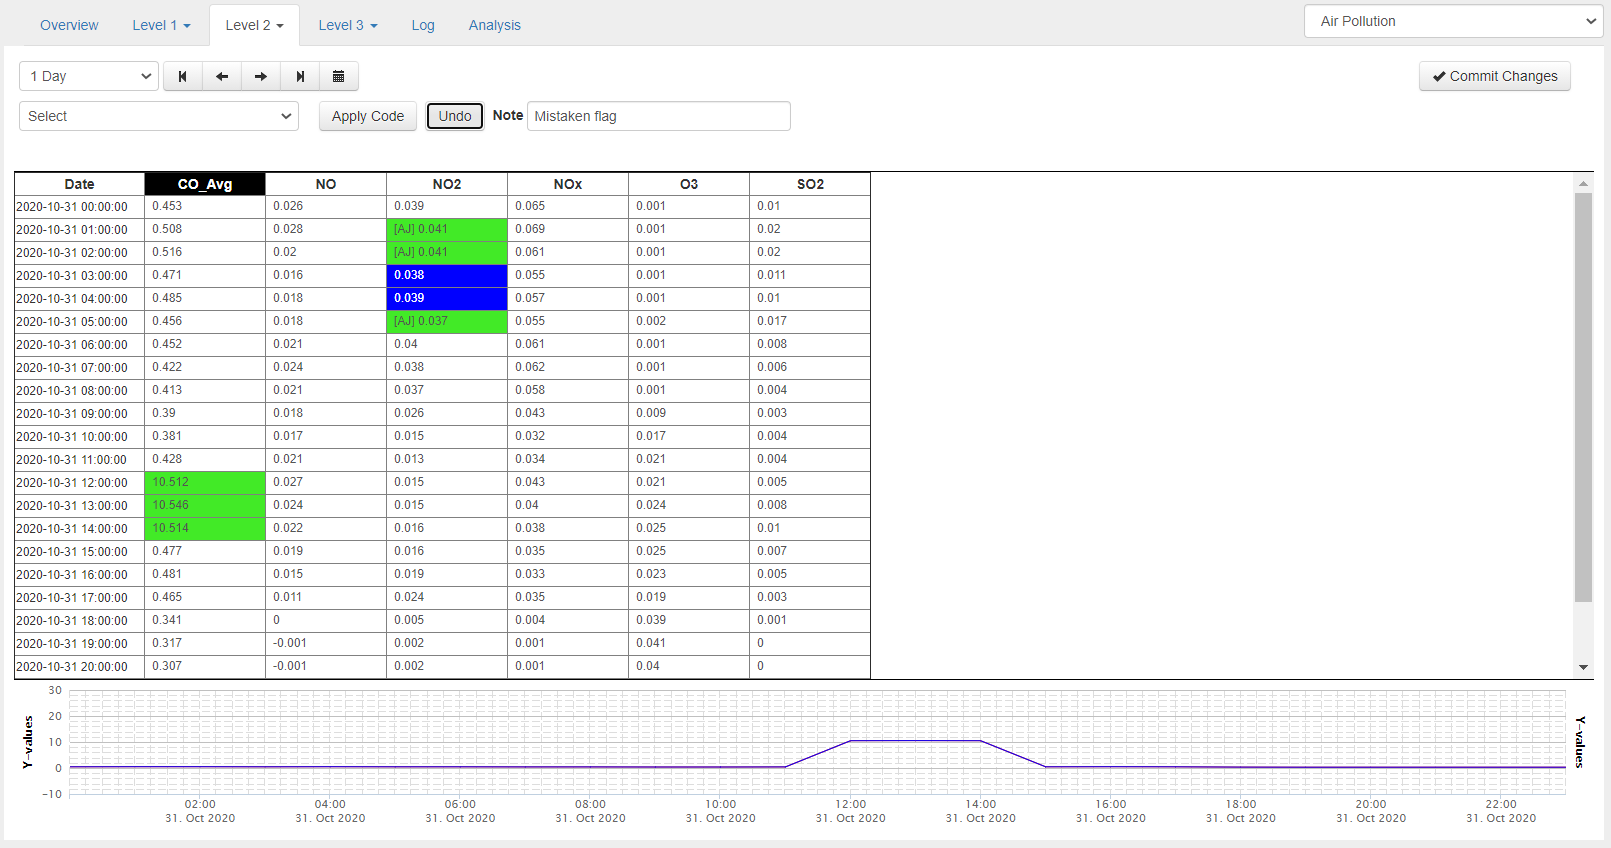
Add a note to the removed data box and commit the changes.
The final step is to Review Period, to review a period select Review Period on the top right-hand side and the Review Period window will open up.
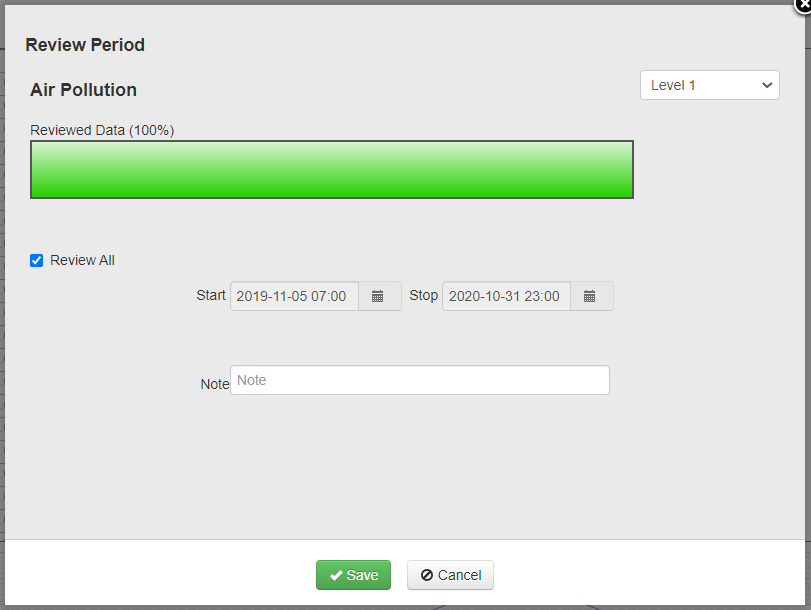
The user can select if he wants to review the whole period or just one part of it, add a note if needed and click Save.
Bulk Edit
Bulk edit makes it possible to make corrections for a selected time period.
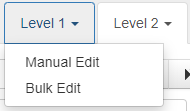
For each level, the user can select either Manual Edit or Bulk Edit.
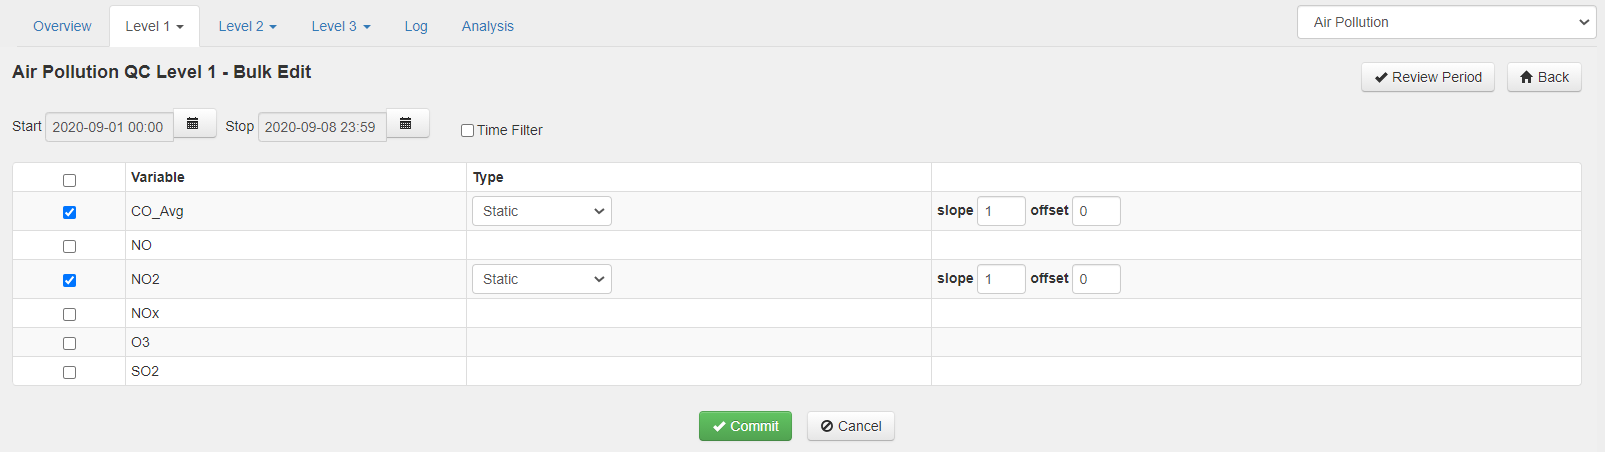
As in manual edit, for level 1 bulk edit, slope and offset need to be set and it‘s possible to select between static or time-varying editing. Additionally, time and date periods need to be defined.
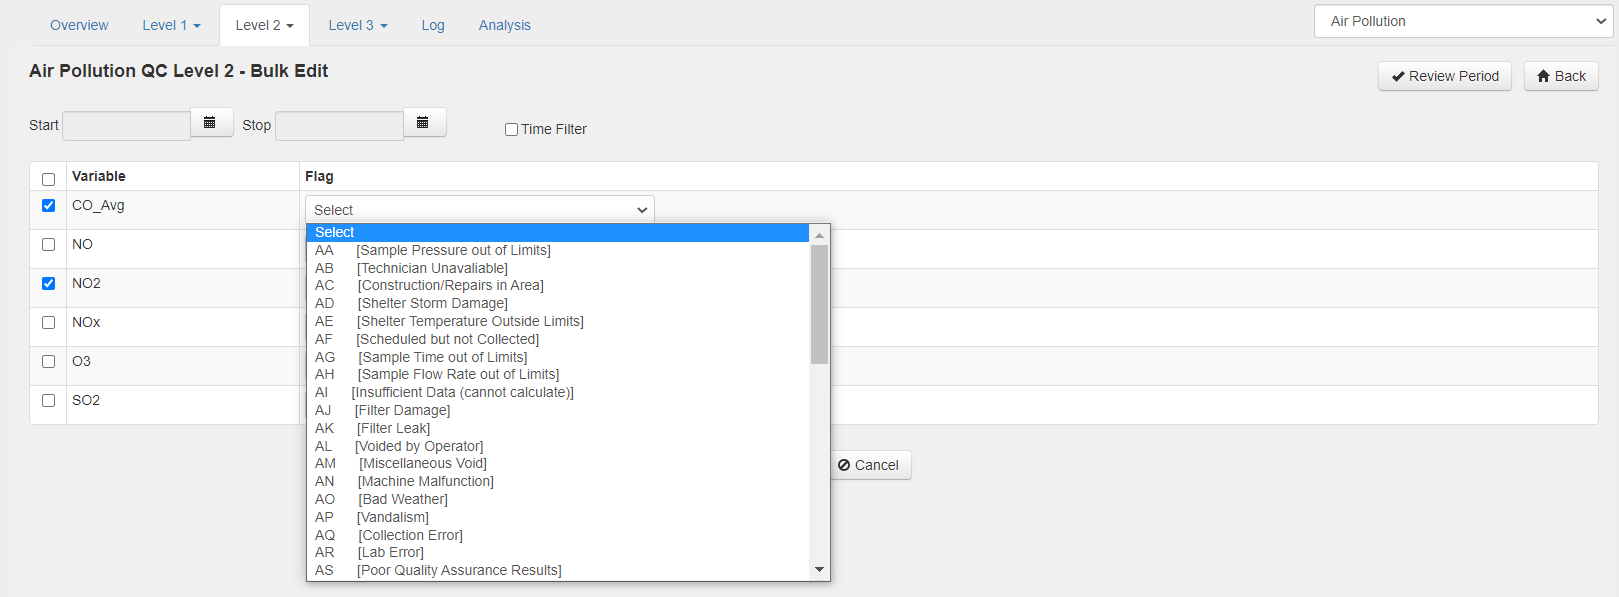
Bulk Level 2 (and Level 3) corrections consist of applying Flags to data for a selected time period.
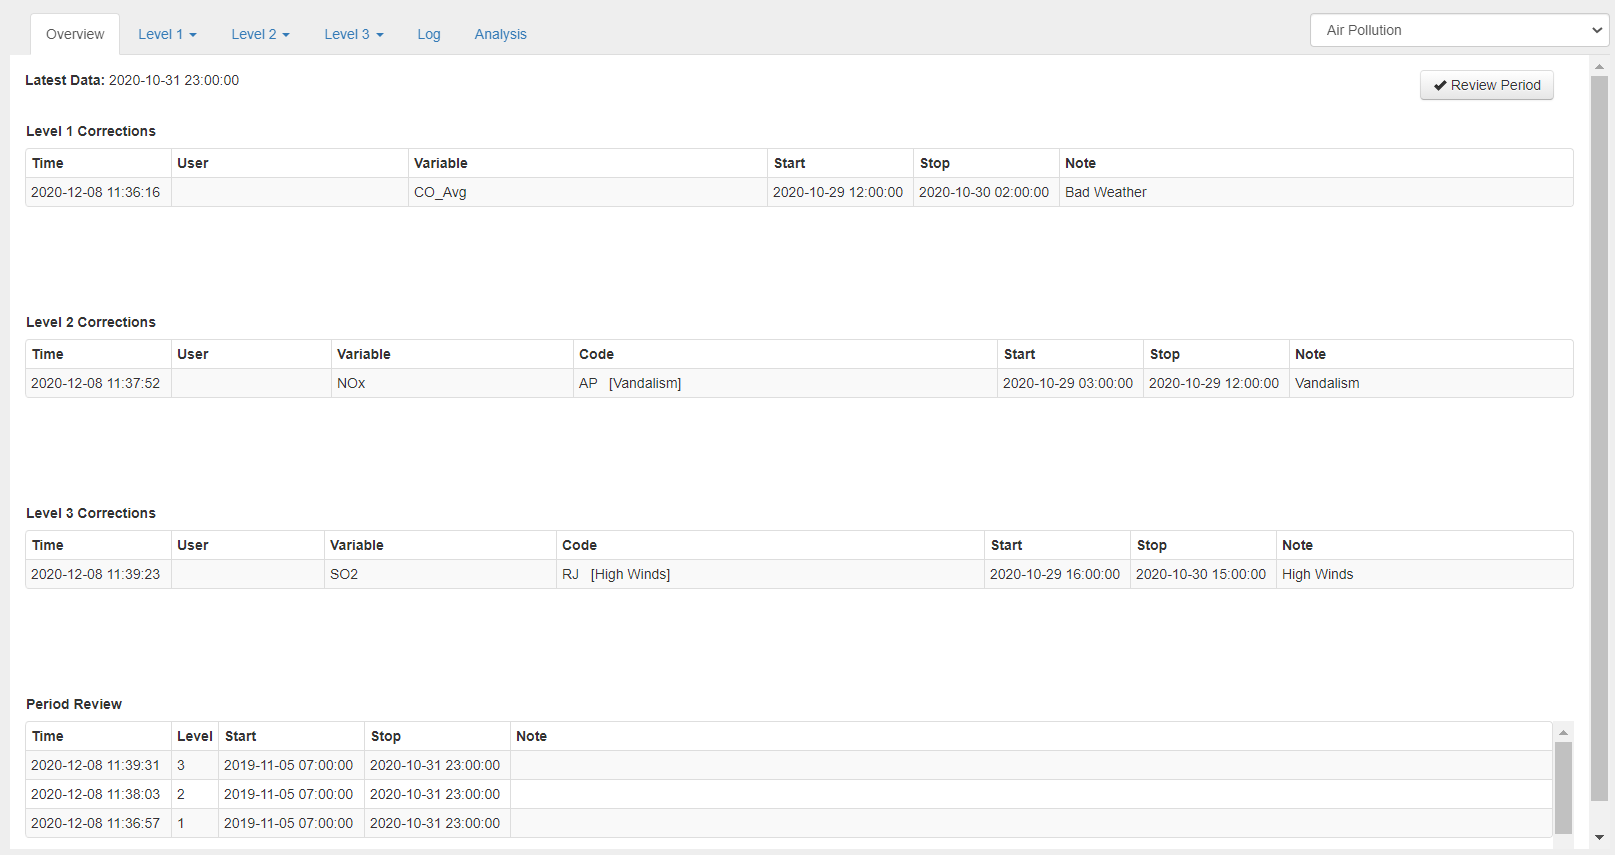
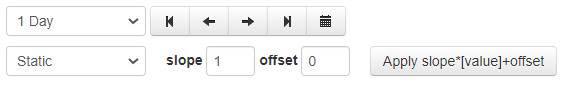
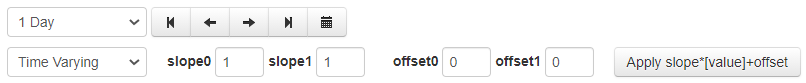
Level 1 corrections
Level 1 corrections are direct corrections of the data done by selecting the Slope and the Offset, they can be made either Statically or Time-Varying.
Level 2 corrections
When a period has been reviewed for Level 1, it's possible to make corrections for Level 2. Level 2 corrections consist of applying Flags to data.
Level 3 corrections
When a period has been reviewed for Levels 1 and 2, it's possible to make corrections for Level 3. Level 3 corrections consist of applying Flags to data just like in Level 2.
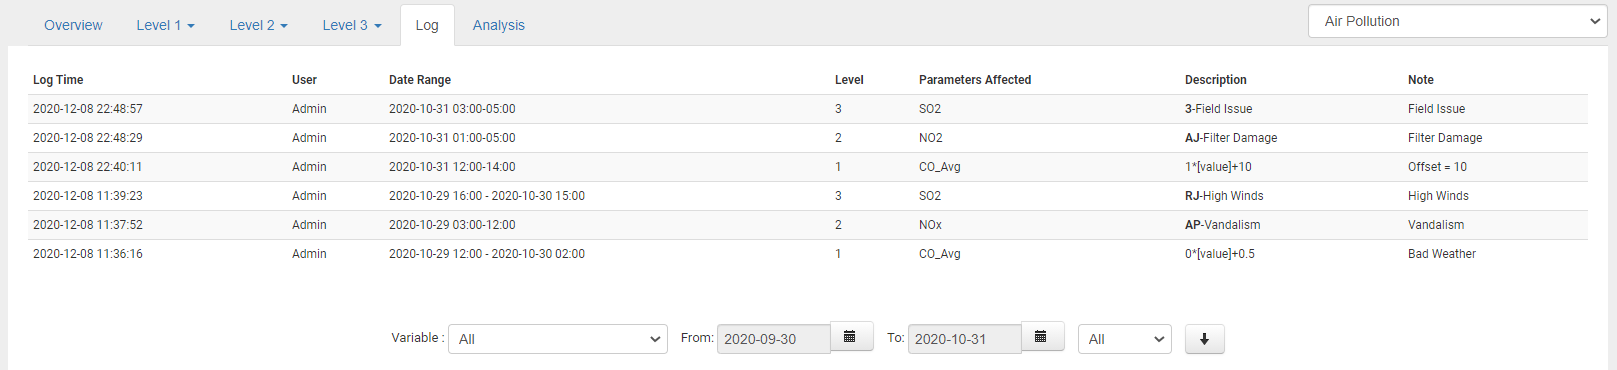
Log
Under the log tab, it is possible to view all the corrections made to the QA/QC Site
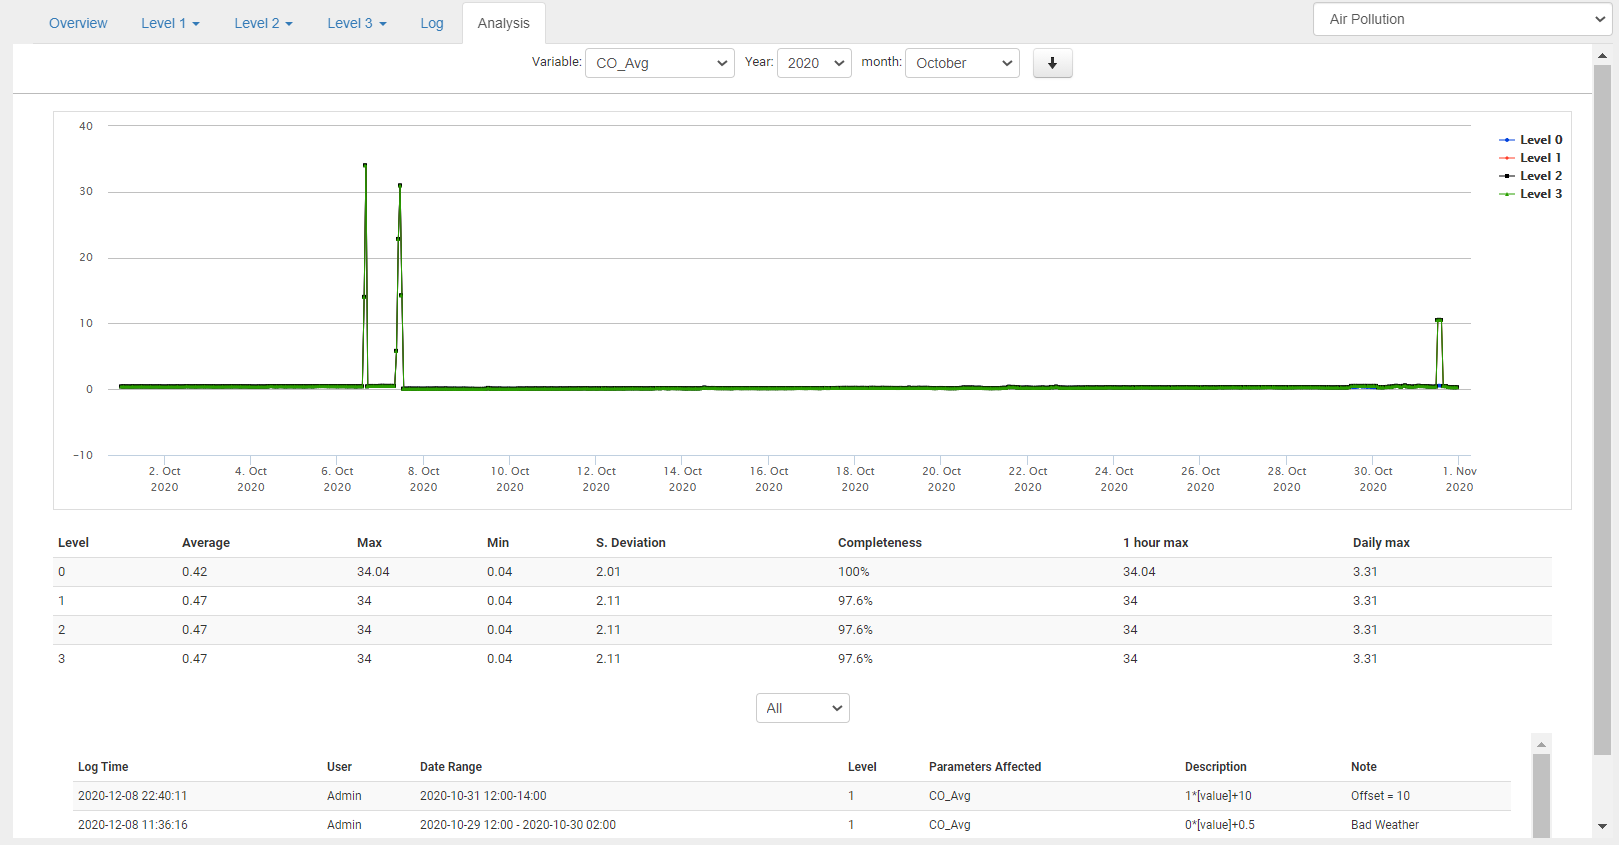
Analysis
Under the Analysis tab, it is possible to view an Analysis of each variable that can be selected from the drop-down menu, it will also give the user a more detailed analysis along with showing all the corrections/Flags placed to that variable for the selected time period.
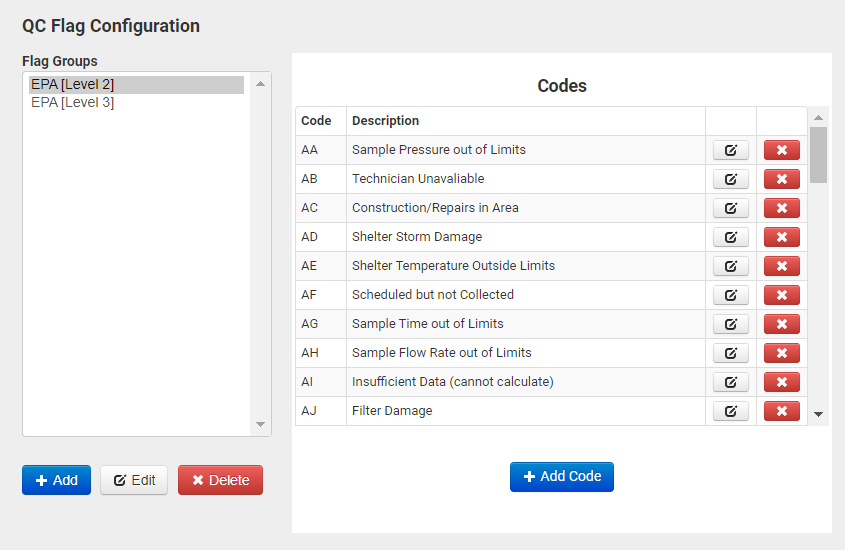
Flag Configurations
Users that have access to the QA/QC flag setup, can edit the Flag Configuration.
EPA is the default flag in VDV. It‘s possible to add new flag groups if necessary.
Under the Edit option, it is possible to select a default flag, what this does is allows the user to set priority within flags if more than one flag is present within the same time period.
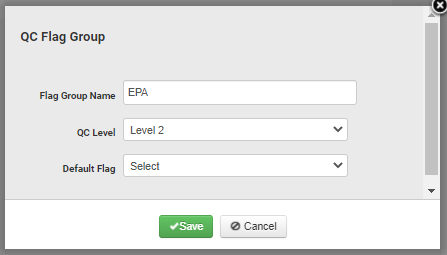
These default flags will be displayed if there are more than two flag types on the same time period, and more than 75% of the values are flagged within the period. These flags will be observed in the Month Overview component in VDV.
Export
To export QA/QC data navigate to the Export tab under QA/QC.
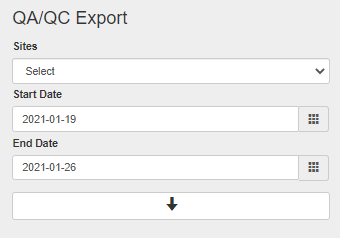
Select what Site to export, and the time period and, click on the download button.
Measurement
Measurement gives the user an overview of the frequency of the measurements taken for each variable.
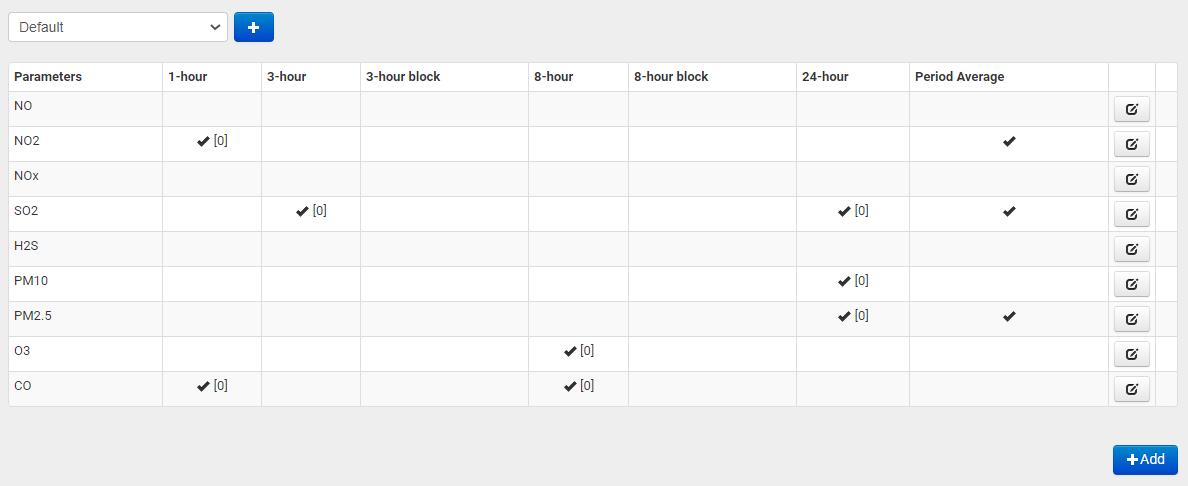
The User can add their own setting by selecting the + sign to create a new Measurement group.
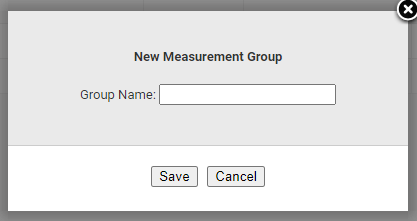
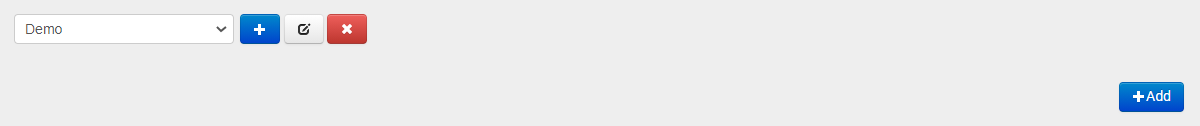
Give the group a name and the group should then appear in the drop-down list.
To add a Variable select +Add
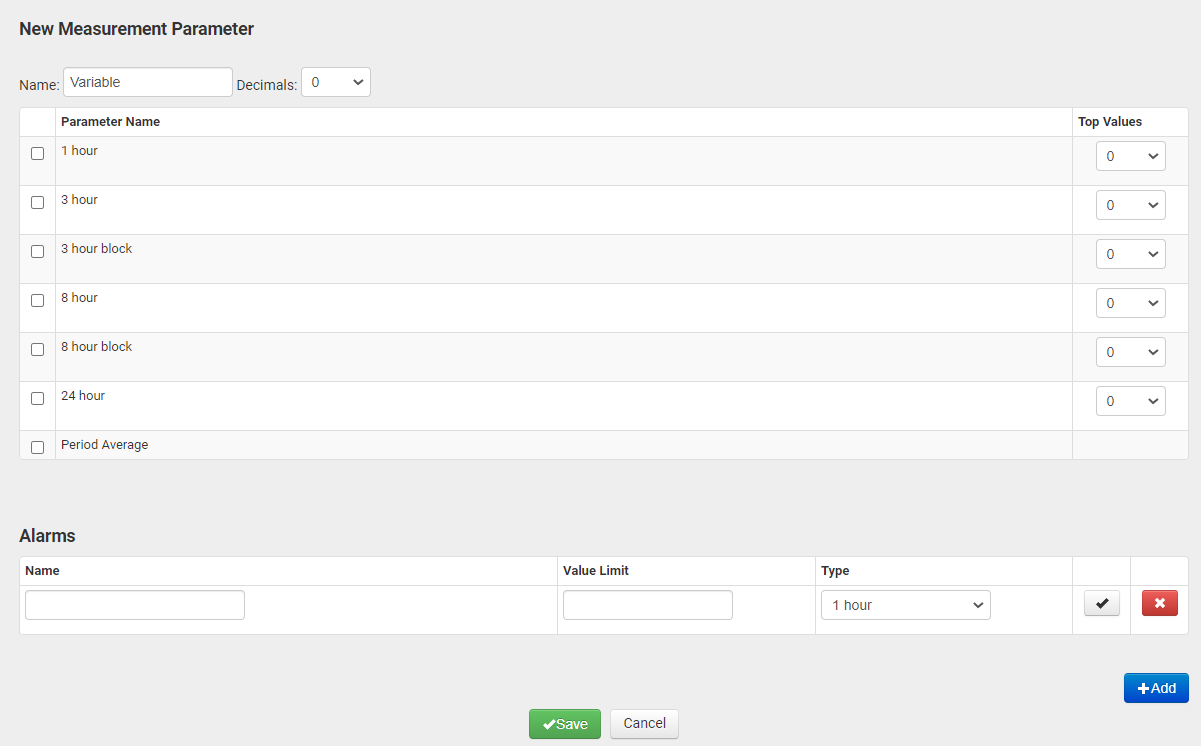
Select the parameter of the period and the top Value (it is possible to select more than one parameter), select if any alarms should be added, and click Save.
Viewing
Viewing QA/QC data can be done on any component in VDV where data is presented, by clicking on the user icon in the top left corner the user menu bar opens up where it is possible to select what level of QA/QC the user wants to view.
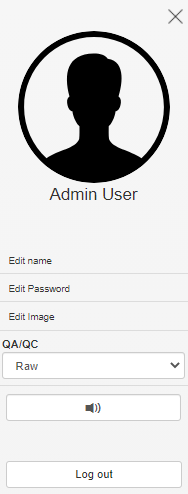
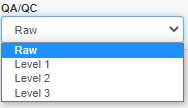
Under QA/QC a drop-down menu will appear where the user can choose what level to view on graphs or any other data presentation tool in VDV.
As seen above the User can scroll between different levels and can with it select what level he wants to view on the graph.
Month Overview also gives the user the option to select what level he is interested in, below the data table it is possible to see the impact the QA/QC flags have on the Data Capture percentage.
The same can be done in any component of VDV where data is presented, the User always has the option to select the appropriate QA/QC level.