Table of Contents
Configure GIS
Create a new GIS
To set up a new GIS map, open the left-hand side menu in VDV and navigate to Setup -> GIS.
Click on the icon in the top right corner to add a new GIS.
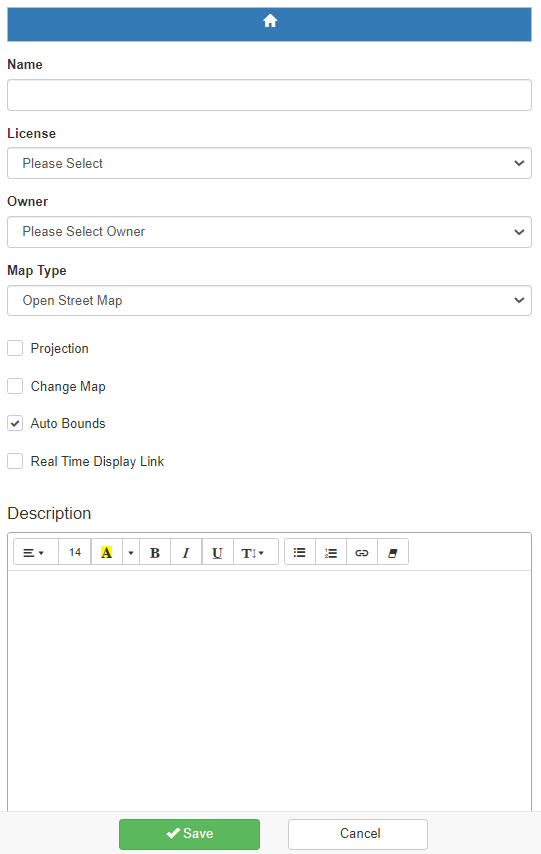
Give the GIS map a name, choose an Installed License, select the owner, and Map Type.
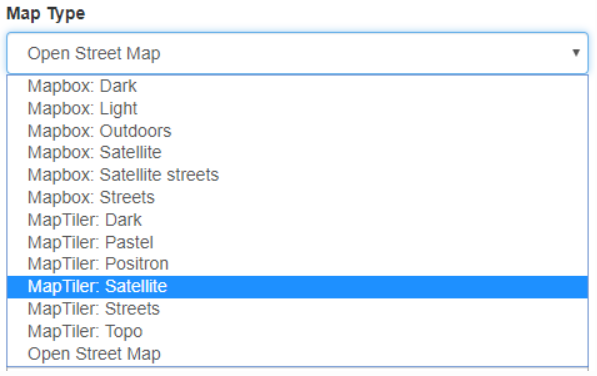
The default option for Map Type is Open Street Map but it is possible to add Base maps through a Third-Party Service Provider.
If Auto Bonds are selected, it automatically zooms and centers the map. For manual setup, uncheck the checkbox.
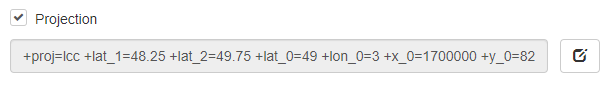
Projection
Add a custom projection to a GIS map in the GIS setup. Use project-specific projections for all coordinates in the GIS setup.
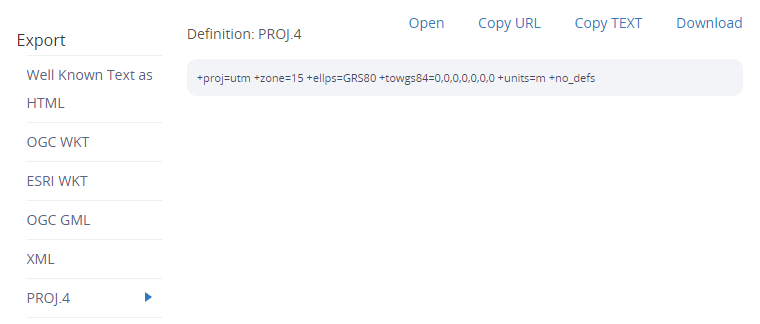
To find a specific project configuration for VDV, use the http://epsg.io/ website. Enter the projection name (e.g., UTM Zone 15N (NAD83)), and look at the result set. Select the listing matching the projection: http://epsg.io/26915
At the bottom of the page under Export, select the PROJ.4 option and use the Definition string in the VDV GIS setup:
+proj=utm +zone=15 +ellps=GRS80 +towgs84=0,0,0,0,0,0,0 +units=m +no_defs
It is also possible to include grid shifting in the projection configuration.
Grid shifting can be enabled by adding the following parameter at the end of the projection configuration:
+nadgrids=ntv2
Currently, only the NTv2 grid shift is supported.
Add Markers
Click on the Marker icon and create a new Marker. There are a few different options available.
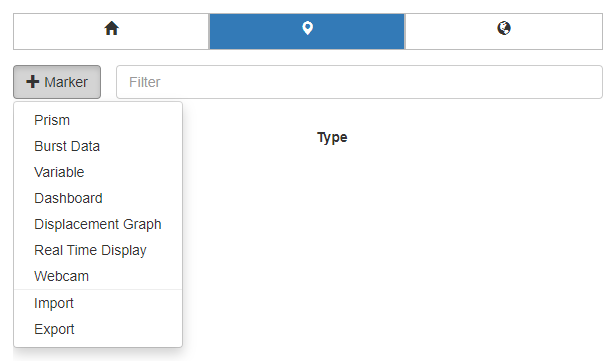
Prism: Link directly to Prism data; the marker will display as the vector sum of the Prism.
Burst Data: Link directly to a burst project; the project will open when the marker is clicked in a popup box.
Variable: Create a Marker with 1 or more variables; they will be displayed as a graph when clicked on.
Dashboard: Link to a Dashboard; the Dashboard will open in a popup box when Marker is clicked.
Displacement Graph: Link to a Displacement graph; the Graph will open in a popup box when the Marker is clicked.
Real-Time Display: Link to a Real-Time Display; the RTD will open in a popup box when the Marker is clicked.
Webcam: Link to a webcam, displayed in a popup box when Marker is clicked.
Import: Mass import markers to the GIS.
The import functionality can be used to:
- Create new markers
- Create markers containing multiple variables
- Update exisiting markers
- Update or add variables to markers
- Update marker positions
- Update marker icons
- Update or add Dynamic markers
Export: Export GIS markers to a single file containing all marker variables present on a GIS map. The exported file can be modified and imported to make changes to markers or to add new markers to the GIS map.
The exported file contains all the information about the properties available for GIS variable markers as well as how to format your marker import.
The exported file can be used as a template for a marker import.
Prism
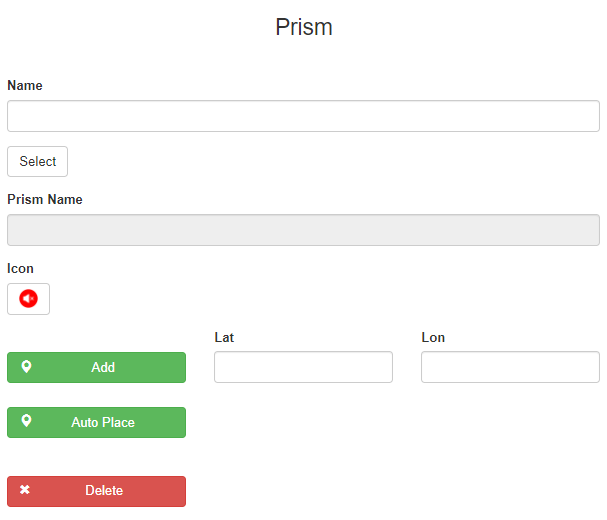
Under Marker, select Prism from the drop-down list.
Click Select to get a list of all Prisms in the VDV system (the name will automatically be used as the GIS marker but can be manually changed after the Prism is selected).
Chose an Icon for the Prism.
Click Add/Remove to Add the Prism manually to the GIS map.
It is also possible to Auto place the Prism on the map. If this option is selected, VDV will automatically place the Prism on the map according to the information in the data.
Burst Data
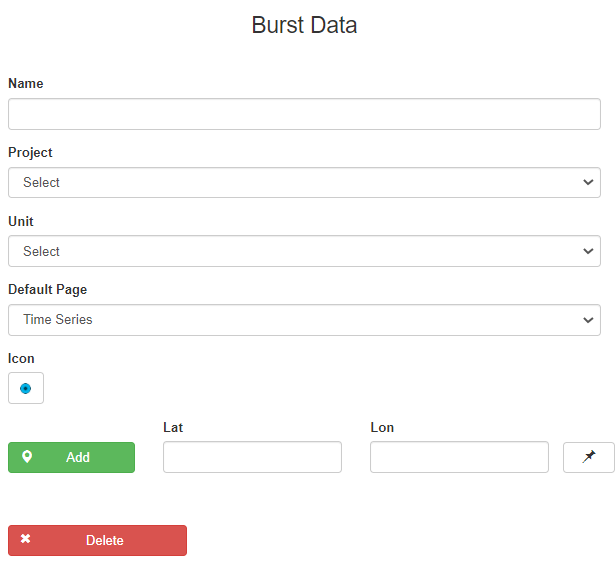
Under Marker, select Burst Data from the drop-down list.
Give the Marker a name, select the Project, the Unit, and the Default Page to display when the marker is selected.
Chose an Icon for the Burst Data.
Click Add/Remove to Add Burst Data to the GIS map.
Variable
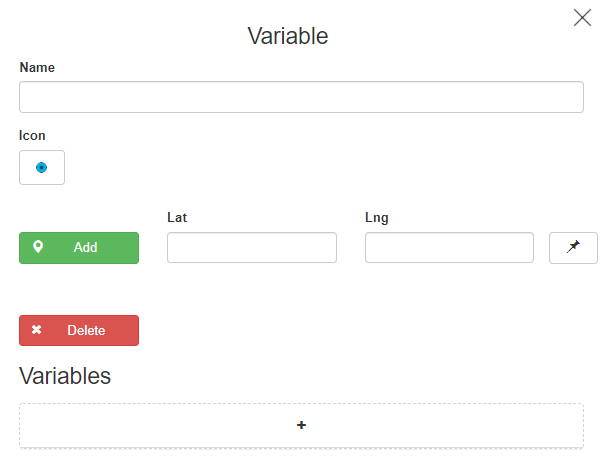
Under Markers, select Variable in the drop-down menu.
Click the Icon to choose the icon for the Marker.
Click the + icon to add a Variable to the GIS map.
Click Add and click on the map to place the Marker.
Dashboard
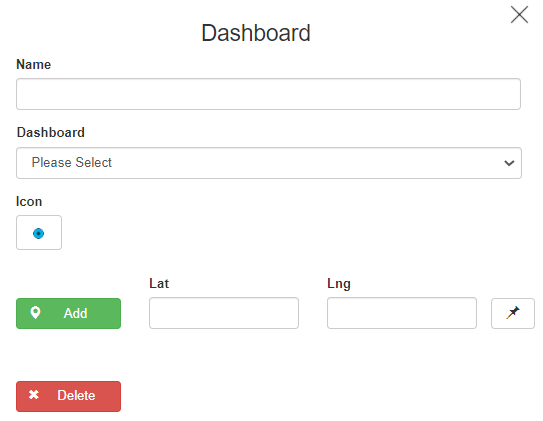
Select the Dashboard to use from the drop-down list.
Give the Dashboard a name (if you wish, change it from the one currently assigned).
Select an existing Dashboard from the drop-down list.
Choose an Icon for the Dashboard.
Click Add/Remove to add it to the GIS map.
Displacement Graph
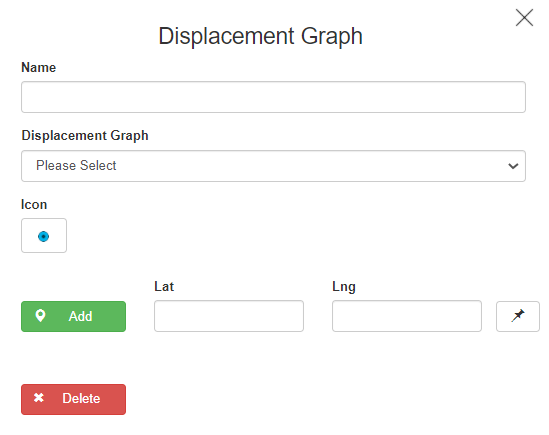
Select Displacement Graph from the drop-down list.
Give the Displacement graph a name (if you wish, change it from the one currently assigned)
Select an existing Displacement graph from the drop-down list.
Chose an Icon for the displacement graph marker.
Click Add/Remove to add or remove it to the GIS map (or click on the pin to make it a dynamic marker)
Real Time Display
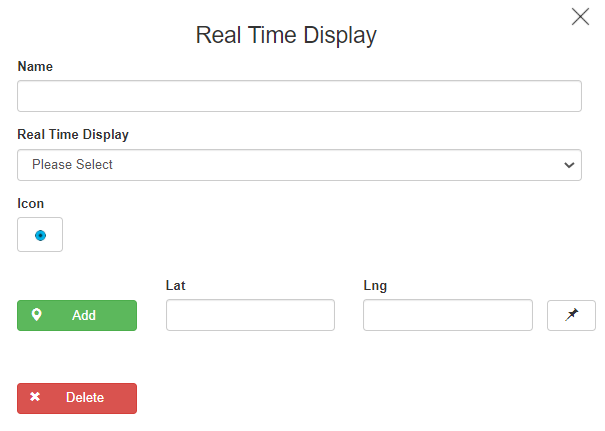
Select RTD from the drop-down list.
Give the RTD a name (if you wish, change it from the one currently assigned).
Select an existing RTD from the drop-down menu.
Chose an Icon for the RTD marker.
Click Add/Remove to add or remove it to the GIS map (or click on the pin to make it a dynamic marker).
Dynamic Markers
Markers on GIS maps can be either manually assigned or so-called dynamic markers. Dynamic markers have variables that are designated as lat/long variables.
The Lat/long variables are imported as data files under Data Source File Import.
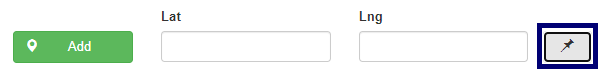
Click on the pin icon to assign fixed or dynamic markers from a variable.
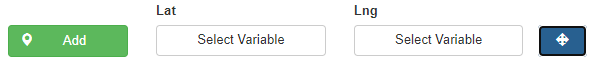
Click select Variable to open up the same Variable selector users are familiar with throughout VDV.
Example of a dynamic marker. The location can be animated over time and its path is shown.
Layers
Adding Layers to GIS maps is a valuable and important function in GIS.
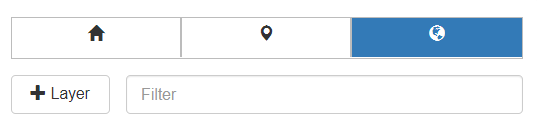
To add layers to maps open the layers menu furthest to the right (as seen in the picture above) in the GIS setup menu and click  to add a new layer to the GIS map.
GeoJson
Select GeoJson from the +Layers list, here Users can upload GeoJson layers directly in the GIS setup
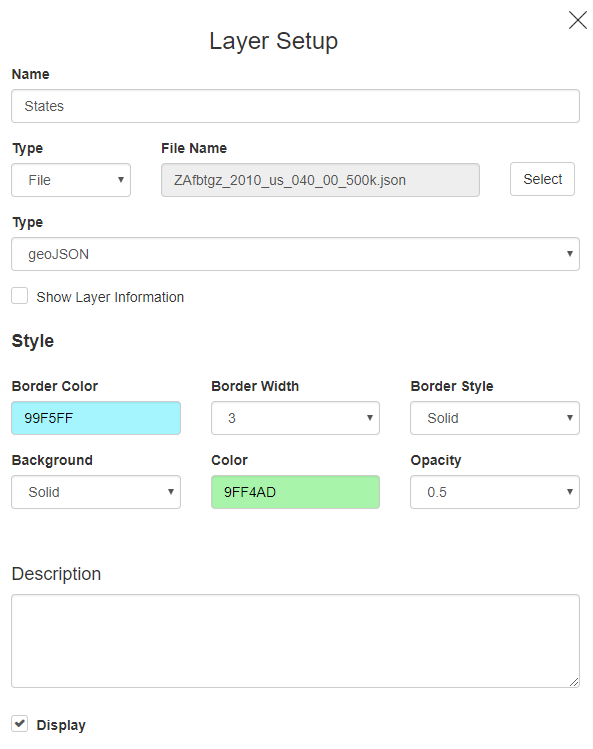
- Start by choosing the layer file.
- Choose Border Color, Border Width, and Style.
- Background can be Solid or Scale.
- With Scale, the layer can have different background colors depending on Layer information values.
- Choose Background Color and Opacity (transparency).
Tiles
It is also possible to add Tile Layers to GIS maps, select Titles from the +Layers drop-down menu
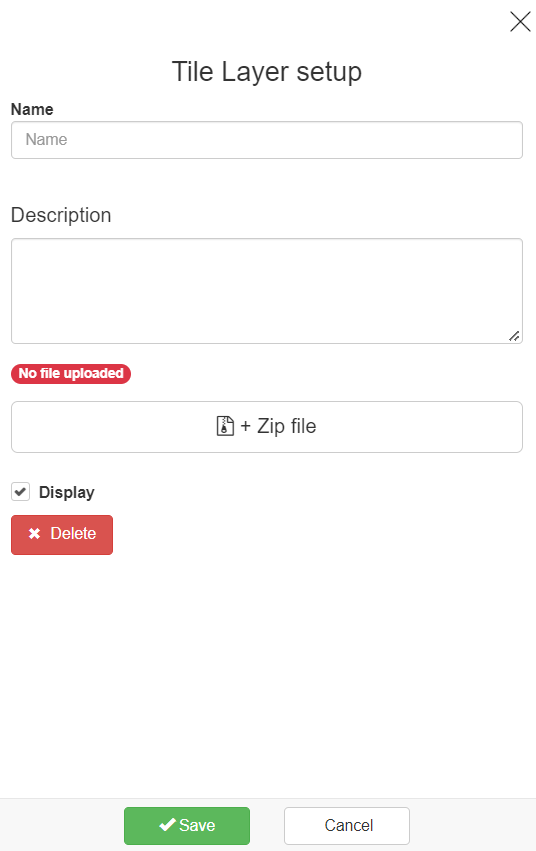
Give the Title a name and a description (if needed) and upload the Title file, select if the Title should be displayed, and click Save.
Tunnel
This Layer type is part of the Cross-Section function in GIS (a licensed component in VDV)
WMS, WMTS, TMS
These are parts of the Third-Party Base map Providers in VDV, and can be in addition to being Base maps be used as Layers.
In the +Layers setup, list select one of the following WMS/WMTS/TMS
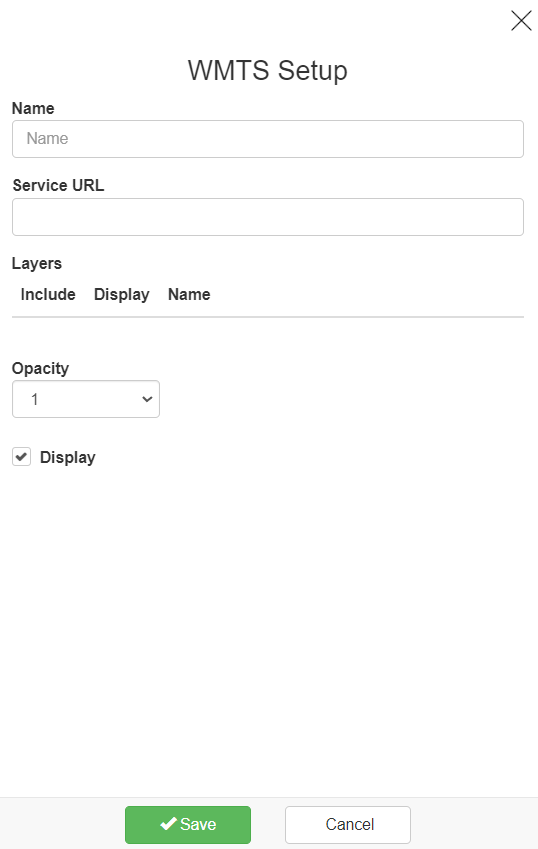
Give the Layer a name and enter the Service URL, once it is entered the Layers will appear under the Layers list, Select the Layers that should be Included by selecting the checkmark in front.
For an example /WMSserver?Request=GetCapabilities
Choose the Opacity from the drop-down list and hit Save.
If the Layer should be displayed on the Map select the checkmark in front of the Display option.