Manual
Alarm
Burst Data
Dashboard
Data Source
Manual Inclinometer
Loadsensing
Ackcio
CSI
File Import
Geokon
SAA
Sigicom
Total Stations
Waste Management
Profound
Axilog
GSS
Webcam import
Displacement Graph
GIS
Historical Graphs
Real Time Display
Virtual Variables
SSO
Setup Azure AD for VDV
Setup Single Sign-On in VDV
Single Sign-On setup checklist
Manual provider setup
Analysis
API
Contacts
Contact Groups
Completeness
Data Export Task
Documents
Download Data
Localization
Notes
Month Overview
Reports
Site Setup
QA/QC
Project
Prism
Update Overview
Users in VDV
Manual Import
Setting up a webcam
Embed API
Webcam
User interface
License Overview
Graph Configuration
Site Map
Quick View
Videos
Guides
After install action list
Install VDV on-premise
Creating a new project
Installing scheduled tasks
Restarting the Vista Data Vision System
Exporting site and unit lists from db.robot.c
Exporting the settings from the File Converter
Muting sounds in VDV
Updating VDV with the store in offline mode
Migrate/Move Vista Data Vision to a new server
FAQ
Server Side
File Converter gets empty
Update header - new sensors added to the data file
Import modified or historical data
The VI Not Executable
Email subject contains information from the mail server
Webcam not importing pictures
How to configure Text Message Service
Run tasks minimized
Units
System Requirements
Backing up VDV
Front end
How to extend VDV Timeout
System validation after PHP 8 update
- All Categories
- Manual
- Dashboard
- Viewing Dashboards
Viewing Dashboards
Updated
by Ragnar Tryggvason
When viewing a Dashboard, you have multiple options to work with the data. You can zoom in and out, download the data, download the graphs and change the Time Scale.
Dashboard settings
By clicking on the ... icon in the top right corner, you can modify the time scale of the Dashboard and also scroll in the data. If users have access to Dashboard Settings, they will also see an Edit button to modify that specific Dashboard.
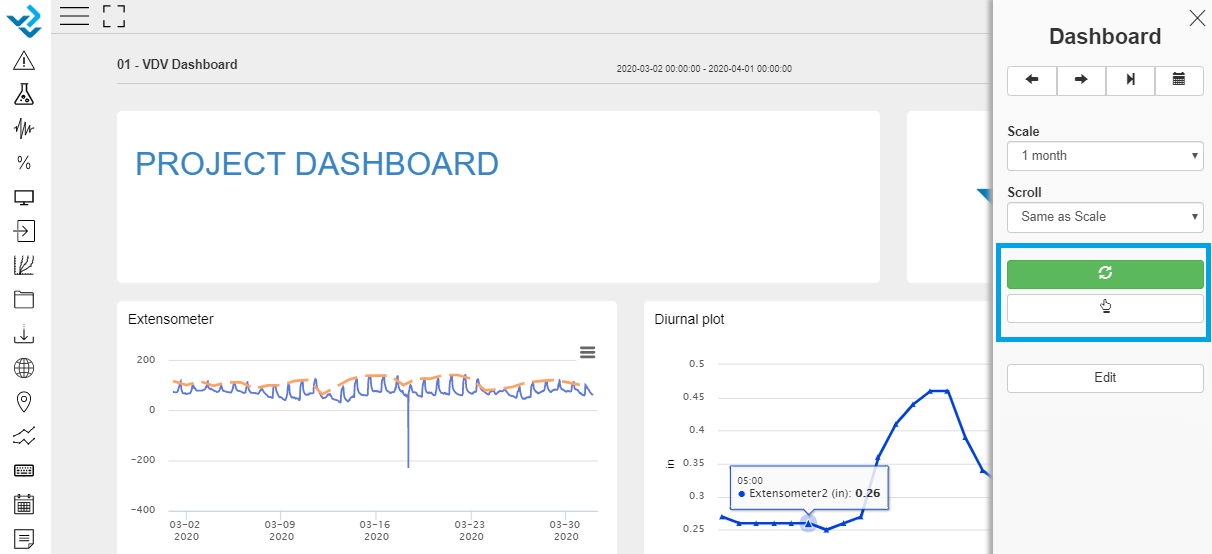
These two buttons do the following
- Stop to Auto Refresh the Dashboard. By default, the dashboard is refreshed for new data every 30 seconds. That can be stopped by clicking that button.
- If the finger button is selected, all Numeric Indicators will update according to the graph you are hovering over. Meaning they will show the value of that sensor for the same timestamp when hovering over the graph.
Working with Graphs
You can
- Zoom in-and-out on any graph
- Enlarge any graph (and any other component)
- Download the data to your computer. That will download the time period you are viewing.
- Download the Graph itself to use as you want.