Historical graphs allow the user to customize a page with graphs for monitoring trends and the evolution of variables through a selected period. They can be helpful in monitoring trends and comparing values over a long period.
Setup
To set up a historical graph page, navigate to the historical data setup on the left side menu under and Historical Data.
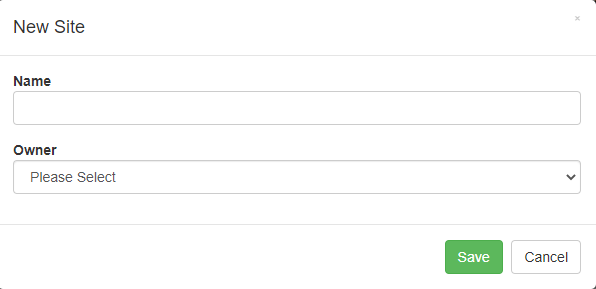
Click on the + sign, and the New Site window will appear. Give the new site a name and select an owner.
Under the site name, a drop-down menu will appear.
Click on the new page button to create a new historical data page.
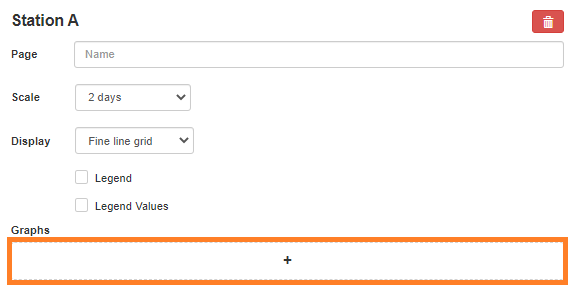
Give the page a name, and select the time scale. It is possible to add grid lines to the graph in the drop-down menu under Display.
To add a graph to the page, select the + icon.
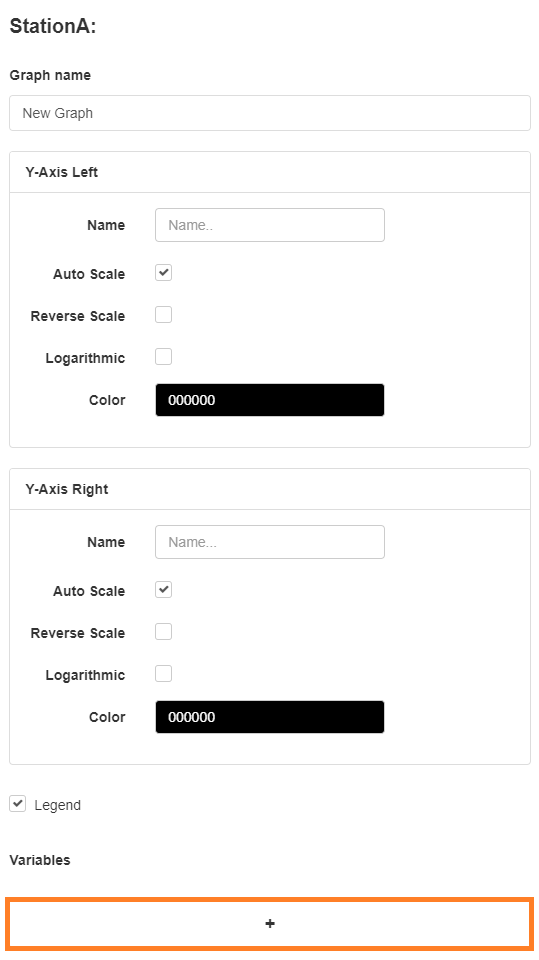
Give the graph a name and click on the + sign under Variables to add variables to the graph.
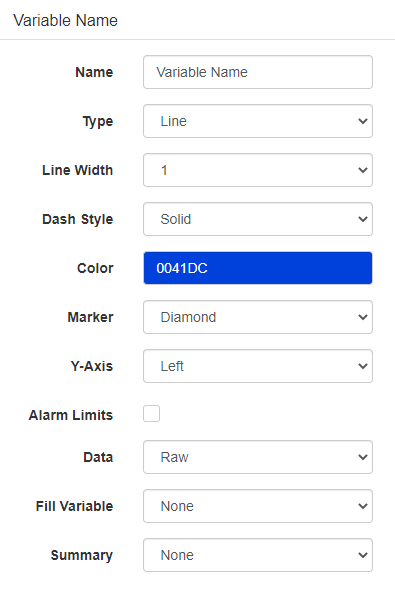
Fill in Information on the variable/s and click Apply to save the graph.
To delete a graph, click in the upper right corner and the delete graph window will appear on the graph, click yes to permanently delete the graph.
The graph editor is the same one used on the dashboard and offers the same options.
 and Historical Data.
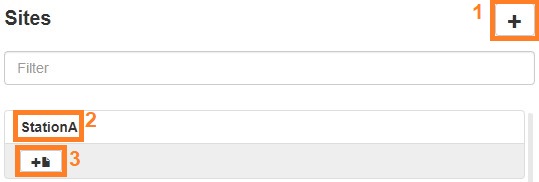
 To delete a graph, click in the upper right corner and the delete graph window will appear on the graph, click yes to permanently delete the graph.The graph editor is the same one used on the dashboard and offers the same options.