Manual
Alarm
Burst Data
Dashboard
Data Source
Manual Inclinometer
Loadsensing
Ackcio
CSI
File Import
Geokon
SAA
Sigicom
Total Stations
Waste Management
Profound
Axilog
GSS
Webcam import
Displacement Graph
GIS
Historical Graphs
Real Time Display
Virtual Variables
SSO
Setup Azure AD for VDV
Setup Single Sign-On in VDV
Single Sign-On setup checklist
Manual provider setup
Analysis
API
Contacts
Contact Groups
Completeness
Data Export Task
Documents
Download Data
Localization
Notes
Month Overview
Reports
Site Setup
QA/QC
Project
Prism
Update Overview
Users in VDV
Manual Import
Setting up a webcam
Embed API
Webcam
User interface
License Overview
Graph Configuration
Site Map
Quick View
Videos
Guides
After install action list
Install VDV on-premise
Creating a new project
Installing scheduled tasks
Restarting the Vista Data Vision System
Exporting site and unit lists from db.robot.c
Exporting the settings from the File Converter
Muting sounds in VDV
Updating VDV with the store in offline mode
Migrate/Move Vista Data Vision to a new server
FAQ
Server Side
File Converter gets empty
Update header - new sensors added to the data file
Import modified or historical data
The VI Not Executable
Email subject contains information from the mail server
Webcam not importing pictures
How to configure Text Message Service
Run tasks minimized
Units
System Requirements
Backing up VDV
Front end
How to extend VDV Timeout
System validation after PHP 8 update
- All Categories
- Manual
- Burst Data
- Viewing Burst Data
Viewing Burst Data
Updated
by Ragnar Tryggvason
VDV Burst Data imports both event and background data, and that data can then be easily viewed using a web interface.
Time Series (Background Data)
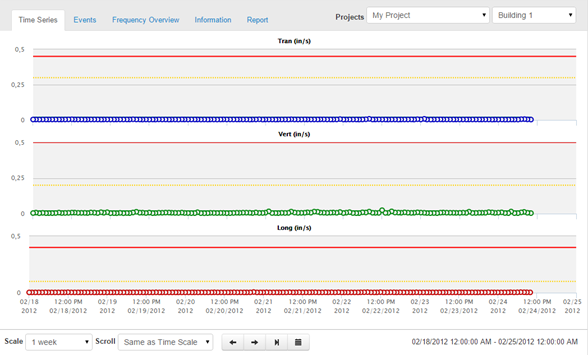
This is the default view for VDV Burst Data. The data is organized into projects, and the user can switch between projects that he has access to by using the drop-down list in the top right corner.
The tabs change between different project information.
When viewing Time Series, the user sees one graph per channel. Here, the graphs have been configured to display the data as points (columns are also an option), and the graphs have also been configured to display the threshold and alarm limits.
The user can easily change the graph scale and scroll through the data using the arrow buttons at the bottom. If the project is configured with Auto Reduce Data, then the data is automatically summarized based on the selected scale. For example, when viewing long periods such as 6 months, the data is reduced to show the maximum value every day instead of showing all the raw data that could be stored as fast as every second.
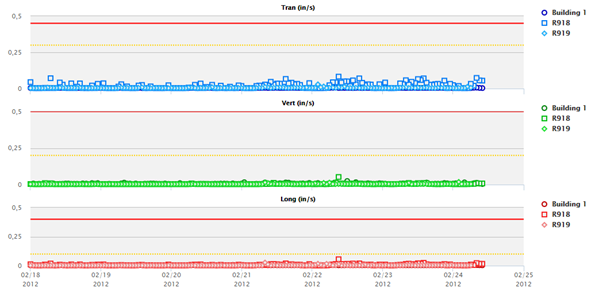
Suppose the Project has multiple units, then the user can select which unit he wishes to view by using the drop-down list in the top right corner. The user also has an option to show all the units simultaneously.

The user will see a tooltip with information about the plots by hovering over the plots.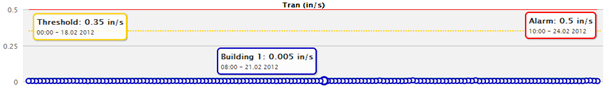
Event Data
The user has access to a list of all the events that have been triggered. The same options as for the Time Series data are available here. The user can change the scale and scroll the data, and the user can also choose to have the table show data from only a specific unit in the project or all units in the project.
For each event, the user has the following options:


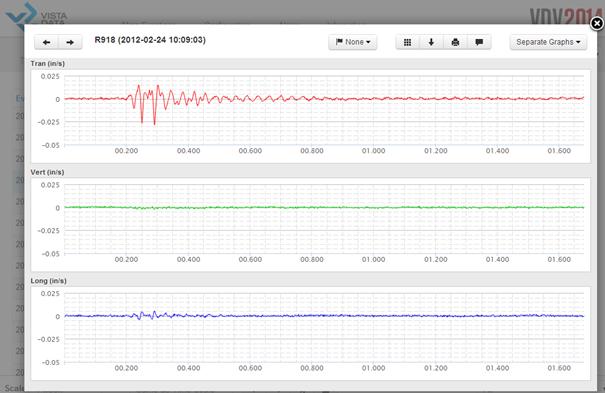
Here the user has chosen to view an event. The plots show the captured event data, and the user can scroll between events by using the arrow buttons at the top.


Flags are created in VDV Burst Data -> Edit -> Event Category
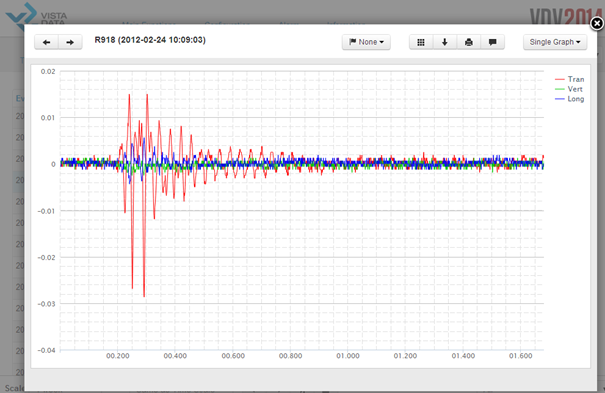
The user can view the data in a single graph with the drop-down menu in the top right corner.
Frequency Overview

The Frequency Overview shows an overview of all events for a selected time period. The Frequency Overview XY plot also shows the selected Project Standard.