Manual
Alarm
Burst Data
Dashboard
Data Source
Manual Inclinometer
Loadsensing
Ackcio
CSI
File Import
Geokon
SAA
Sigicom
Total Stations
Waste Management
Profound
Axilog
GSS
Webcam import
Displacement Graph
GIS
Historical Graphs
Real Time Display
Virtual Variables
SSO
Setup Azure AD for VDV
Setup Single Sign-On in VDV
Single Sign-On setup checklist
Manual provider setup
Analysis
API
Contacts
Contact Groups
Completeness
Data Export Task
Documents
Download Data
Localization
Notes
Month Overview
Reports
Site Setup
QA/QC
Project
Prism
Update Overview
Users in VDV
Manual Import
Setting up a webcam
Embed API
Webcam
User interface
License Overview
Graph Configuration
Site Map
Quick View
Videos
Guides
After install action list
Install VDV on-premise
Creating a new project
Installing scheduled tasks
Restarting the Vista Data Vision System
Exporting site and unit lists from db.robot.c
Exporting the settings from the File Converter
Muting sounds in VDV
Updating VDV with the store in offline mode
Migrate/Move Vista Data Vision to a new server
FAQ
Server Side
File Converter gets empty
Update header - new sensors added to the data file
Import modified or historical data
The VI Not Executable
Email subject contains information from the mail server
Webcam not importing pictures
How to configure Text Message Service
Run tasks minimized
Units
System Requirements
Backing up VDV
Front end
How to extend VDV Timeout
System validation after PHP 8 update
- All Categories
- Manual
- Historical Graphs
- View Historical Data
View Historical Data
Updated
by Ragnar Tryggvason
Viewing Historical Data
To view historical graphs, select Historical Data from the main menu in VDV.
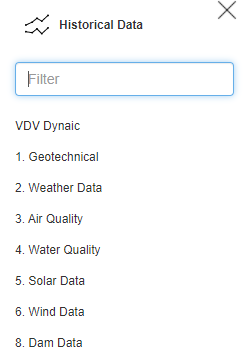
A Historical Data menu will open up on the left side, where the user can select which graph from which site to view.
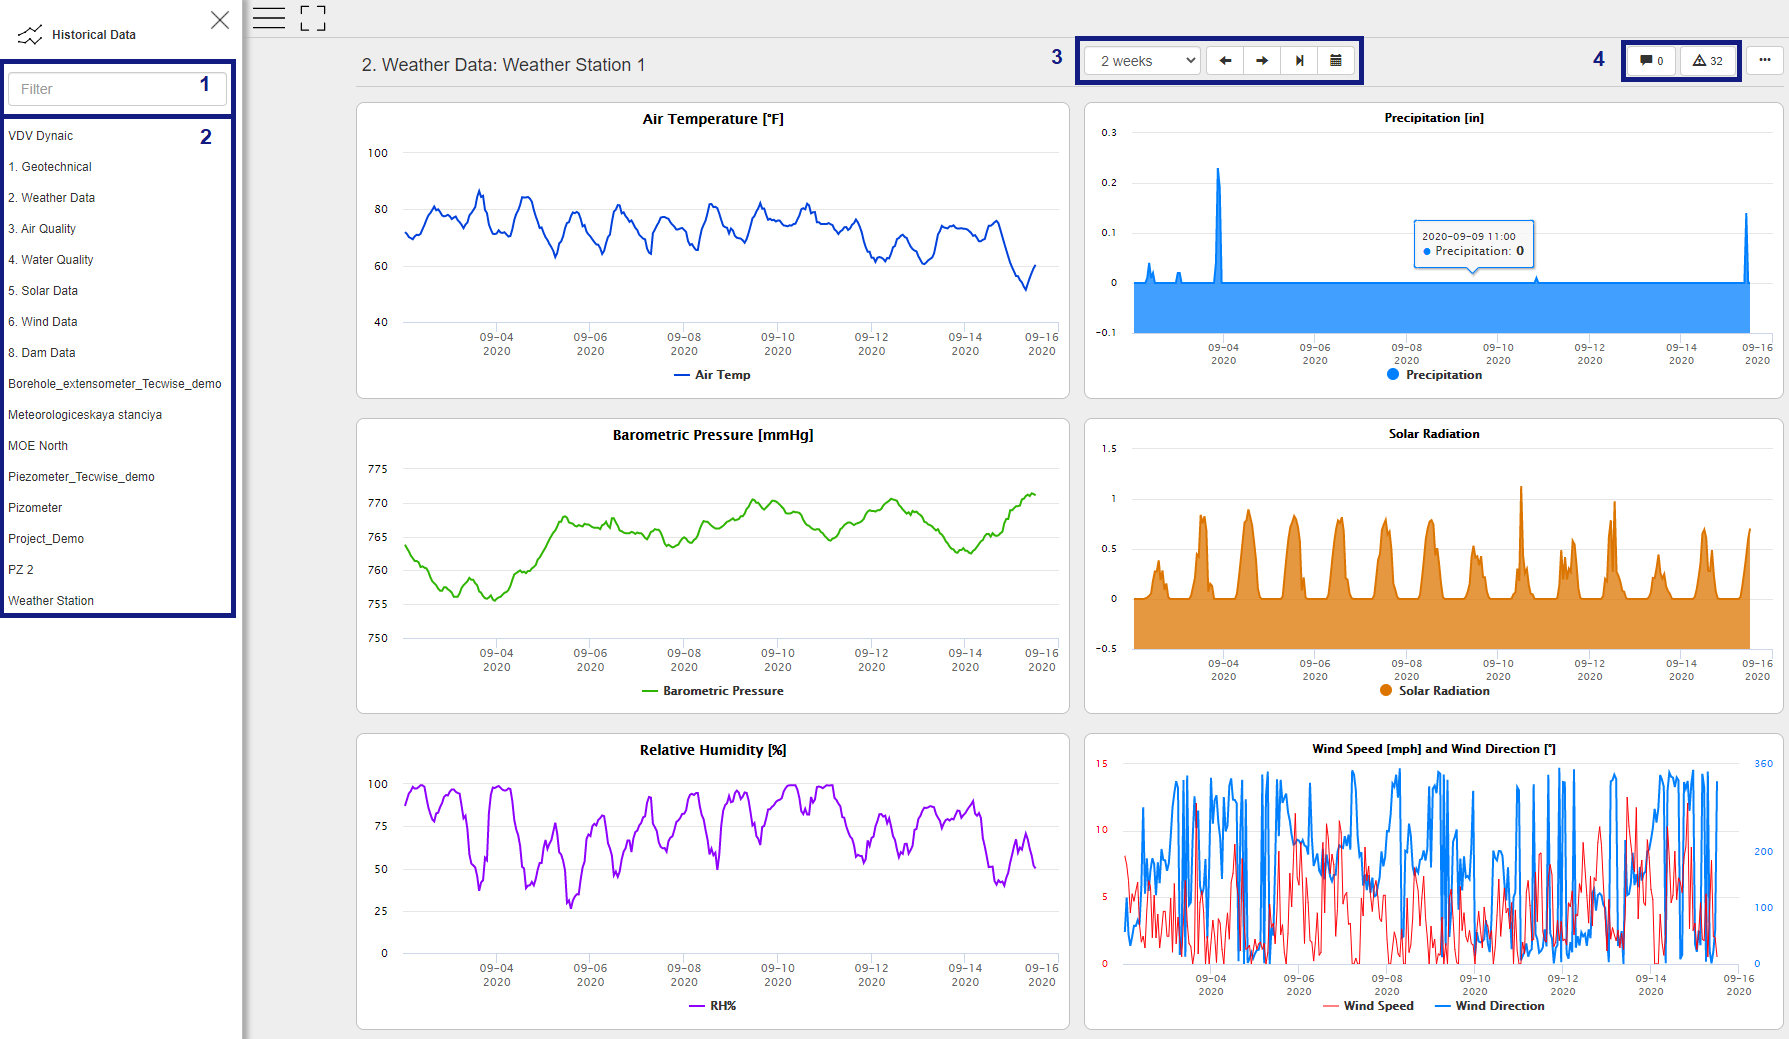
- Filter option to quickly find the Site/Page needed.
- On the left side, all sites and pages are visible. Click on each page to view the Graphs.
- Change the Scale and Scroll back and forth in the data. Use the calendar icon to choose a custom period.
- An Alarm counter shows how many Alarms have been triggered for the displayed variables for the period (1 week in this case). If clicked, then a list of all Alarms is displayed.
If the  is clicked, a menu will appear on the right, with table-view, download data and other features. The options depend on the user's access permissions.

At the top, users can change the length of the scroll. The default is to scroll the same length as the scale. However, users can change this to any value used when scrolling back and forth in the data.
Here users can change to table-view, save data to a text file and view analyzing tools like Overlay Graph, Diurnal and Wind Roses.
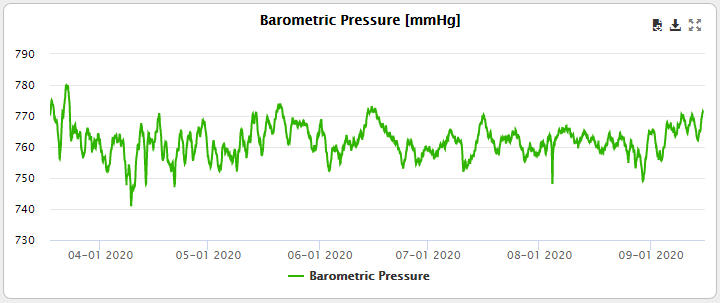
To view each graph in full-screen mode, select the full-screen icon  in the top-right corner.
On graphs with more than one variable, it is possible to toggle one variable off by clicking on it, both in full screen and compact mode.