Manual
Alarm
Burst Data
Dashboard
Data Source
Manual Inclinometer
Loadsensing
Ackcio
CSI
File Import
Geokon
SAA
Sigicom
Total Stations
Waste Management
Profound
Axilog
GSS
Webcam import
Displacement Graph
GIS
Historical Graphs
Real Time Display
Virtual Variables
SSO
Setup Azure AD for VDV
Setup Single Sign-On in VDV
Single Sign-On setup checklist
Manual provider setup
Analysis
API
Contacts
Contact Groups
Completeness
Data Export Task
Documents
Download Data
Localization
Notes
Month Overview
Reports
Site Setup
QA/QC
Project
Prism
Update Overview
Users in VDV
Manual Import
Setting up a webcam
Embed API
Webcam
User interface
License Overview
Graph Configuration
Site Map
Quick View
Videos
Guides
After install action list
Install VDV on-premise
Creating a new project
Installing scheduled tasks
Restarting the Vista Data Vision System
Exporting site and unit lists from db.robot.c
Exporting the settings from the File Converter
Muting sounds in VDV
Updating VDV with the store in offline mode
Migrate/Move Vista Data Vision to a new server
FAQ
Server Side
File Converter gets empty
Update header - new sensors added to the data file
Import modified or historical data
The VI Not Executable
Email subject contains information from the mail server
Webcam not importing pictures
How to configure Text Message Service
Run tasks minimized
Units
System Requirements
Backing up VDV
Front end
How to extend VDV Timeout
System validation after PHP 8 update
- All Categories
- Manual
- License Overview
License Overview
License overview enables users to see a general overview of their projects usage.
The license overview generates daily statistics of each project within VDV. Users can for example see how many variables each project is using and see how a project grows over time.
Different items in VDV have Token values associated with them. For each project the number of items is multiplied by their token value to get the project token usage.
The License Overview is not visible to regular users by default, Admin users can give users access to view the License Overview trough the user setup. This allows project managers to monitor their Project token usage.
The License Overview can be viewed by navigating to Setup->License Overview
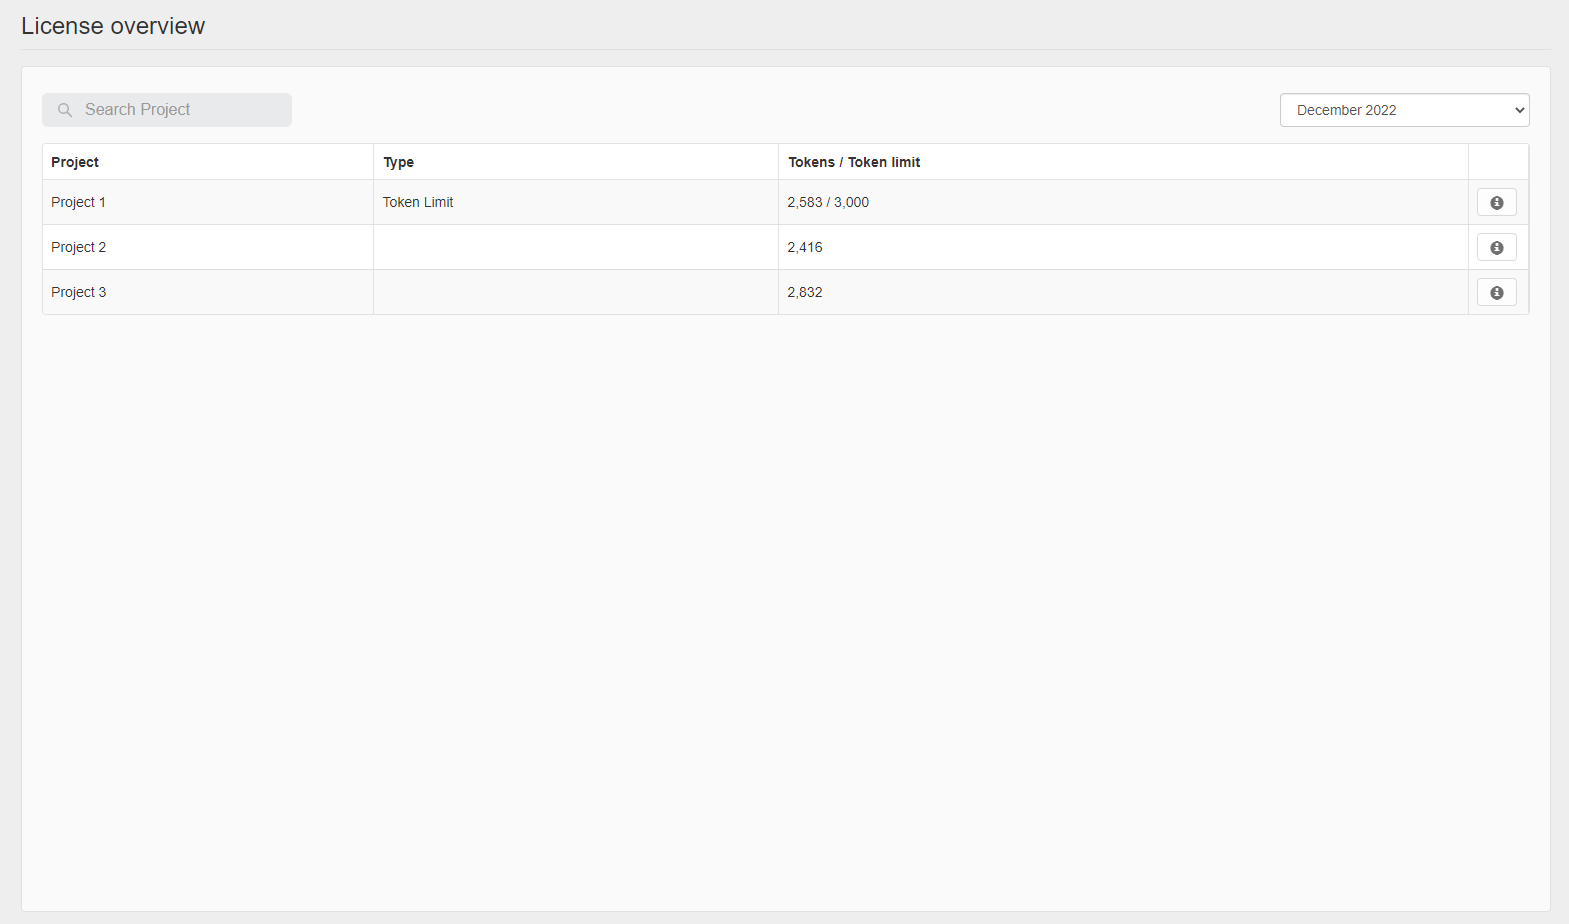
The overview table displays all available projects, their license type and current Token Status/Token Limit.
Users can get a more detailed information about a project usage by navigating to the project trough the information button
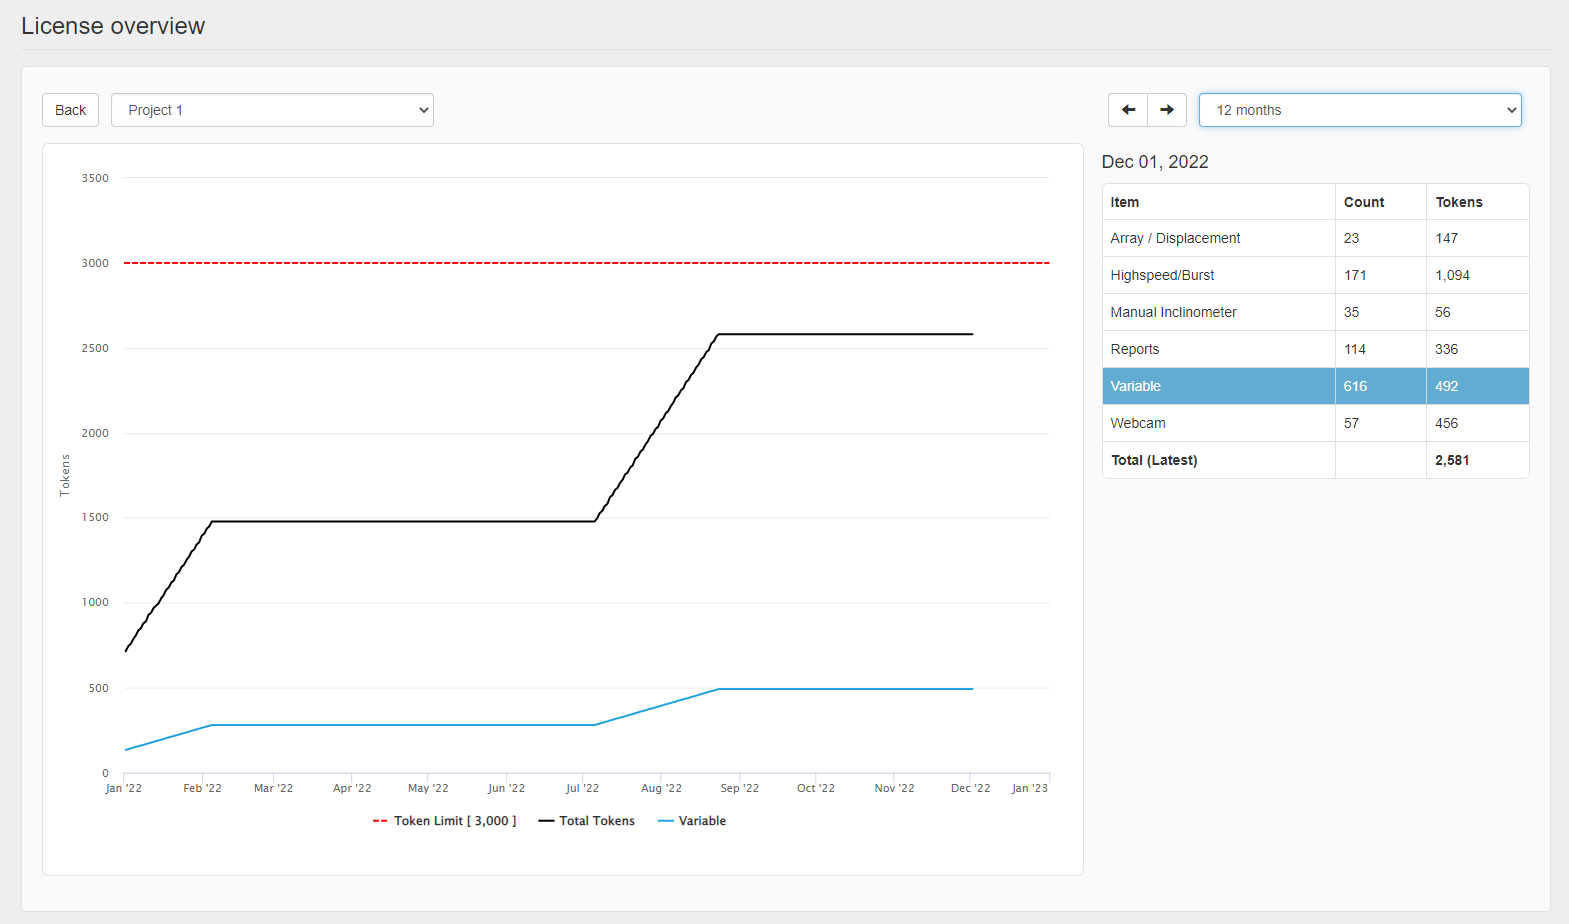
In the details view users can view the usage per project of individual items by clicking on different items. This is useful to see how each item compares to the total usage of the project.
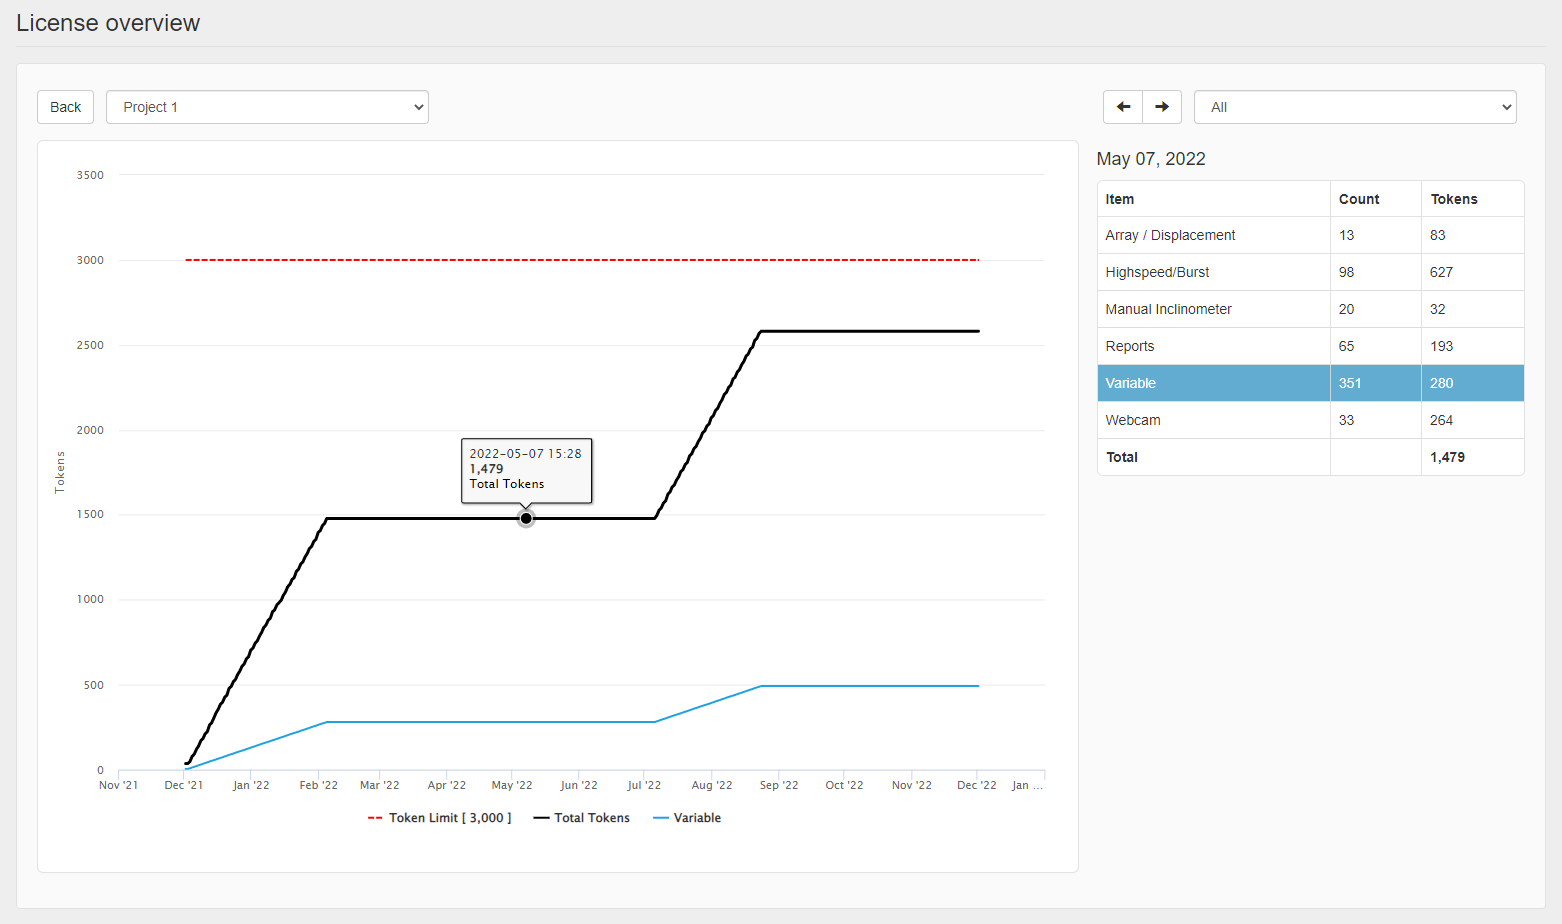
Hovering over a series in the graph will display the usage at that particular time in the usage table.
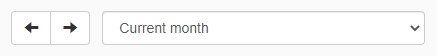
The time controls can be used to view project usage data for different time periods.