Level Indicator
Level Indicator
The Level Indicator enables users to plot and visualize the location and values of a level indicator such as piezometer sensors.
The level indicator will move up and down on the y-axis based on its reading value.
Setup
Plot Area
To configure the Level Indicator first define the plot area of the background image.
- Start by clicking on the "Set Area" button, this will enable you to set the bounds for the Level Indicator.
- Set the bounds by simply clicking on opposite corners of the Real Time Display image.
After the plot area has been defined, you will need to specify the scale of the plot. This is done by filling in the X & Y inputs within the setup. The scale can be set in either meters or feet.
Locations
Create locations on the plot area and add any number of sensors to each location. A location can for example be a standpipe.
To create a location you will need to:
- Assign name to the location
- Choose where the location is on the X-axis of the plot area
- Specify the top point of the location (Point on the Y-axis)
- Specify the bottom point of the location (Point on the Y-axis)
When a location has been created it will render on the plot area in the location that you have specified.
Sensors
- Create a sensor
Sensors are assigned to a location and their install depth within the location needs to be specified.
Each sensor consists of 4 properties:
- Piezometer - Piezometer variable
- Pressure - Pressure variable (Optional)
- Temperature - Temperature variable (Optional)
- Depth - Installation depth of the sensor (Position on the Y-axis)
After a sensor has been created it will display on its assigned location.
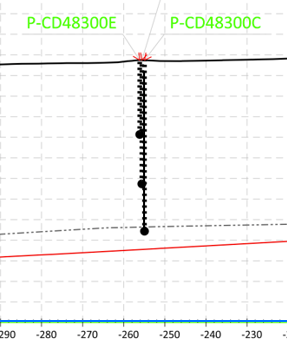
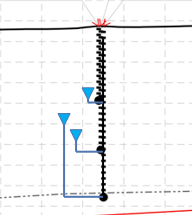
The piezometer sensor has two display items on the RTD.
- Installation Location is showed as a white diamond icon. Hovering over the icon will show the latest Pressure and Temperature readings if they have been selected.
- Sensor Reading is showed as a blue triangle. Hovering over the icon will show the latest reading.
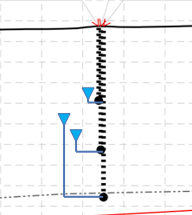
Show Line
The Level Indicator can display a line between sensors, generated from the maximum value of each piezometer variable in each location.
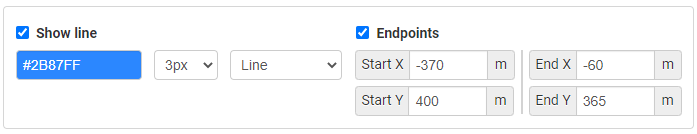
To enable the trend line simply check the "Show line" option. Users can customize the type, color and the width of the line.
Enable "Endpoints" to extend the line to specified points on the plot area. Simply input the X/Y values for each endpoint.
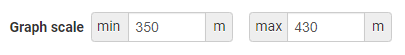
Graph Scale
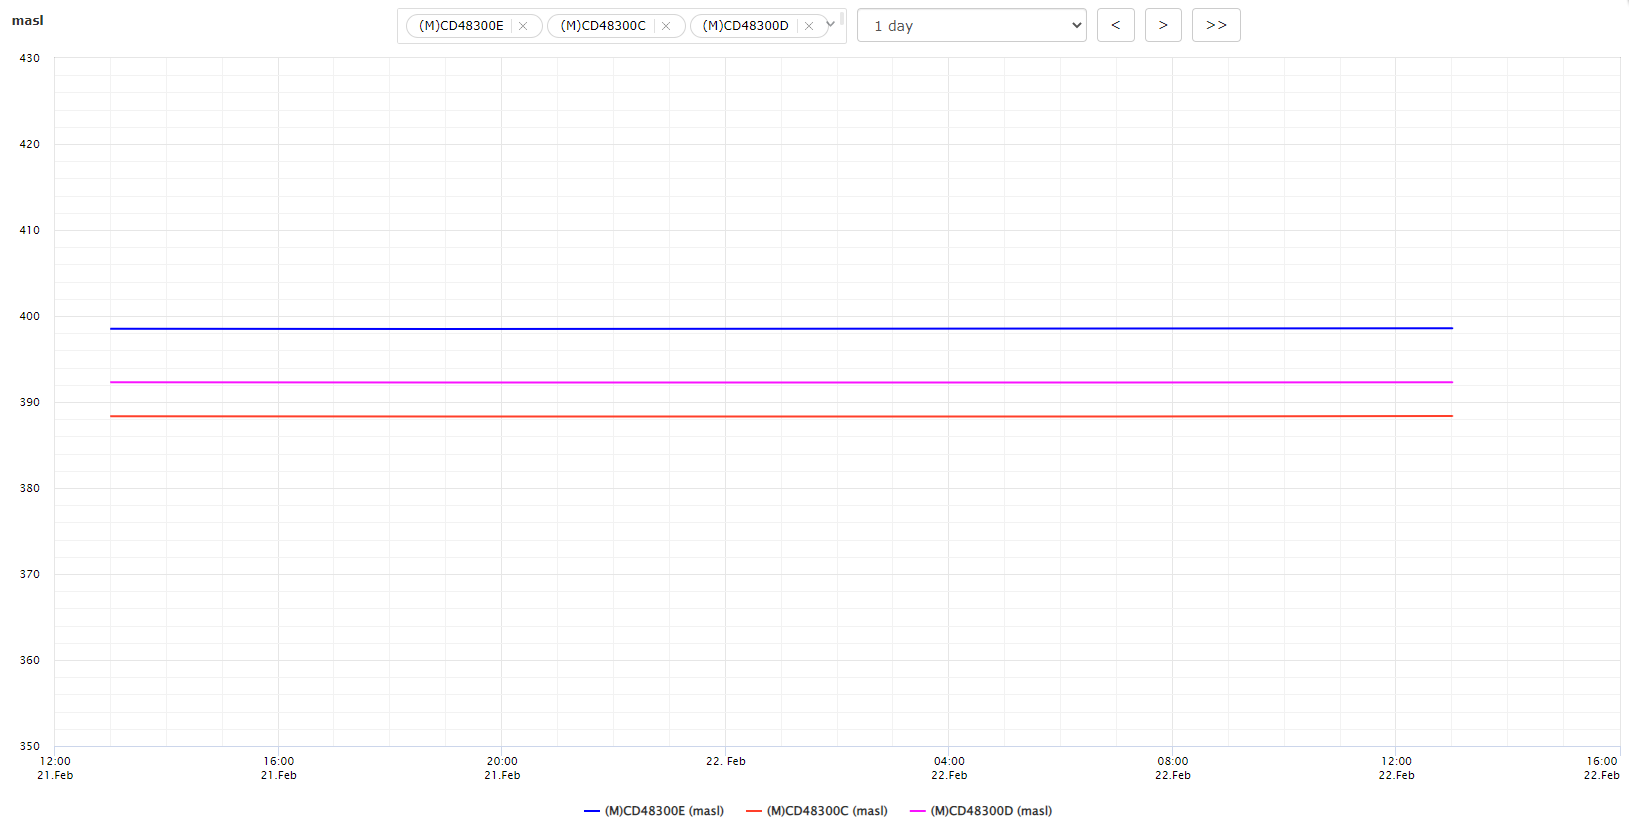
It is possible to set a custom fixed scale for the popup graph. This can be useful to more easily compare readings from different piezometer sensors. If the graph scale is not set then the graph will autoscale.
This will apply to the RTD popup graph if it is only displaying piezometer sensors.
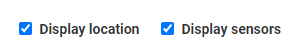
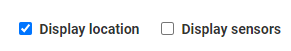
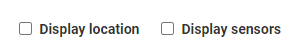
Display Location & Sensor
It is possible to hide the Location and the Sensor installation icon. This can be done both globally for the Level Indicator setup as well as specifically for individual Locations.
 |  |
 |  |
 |  |
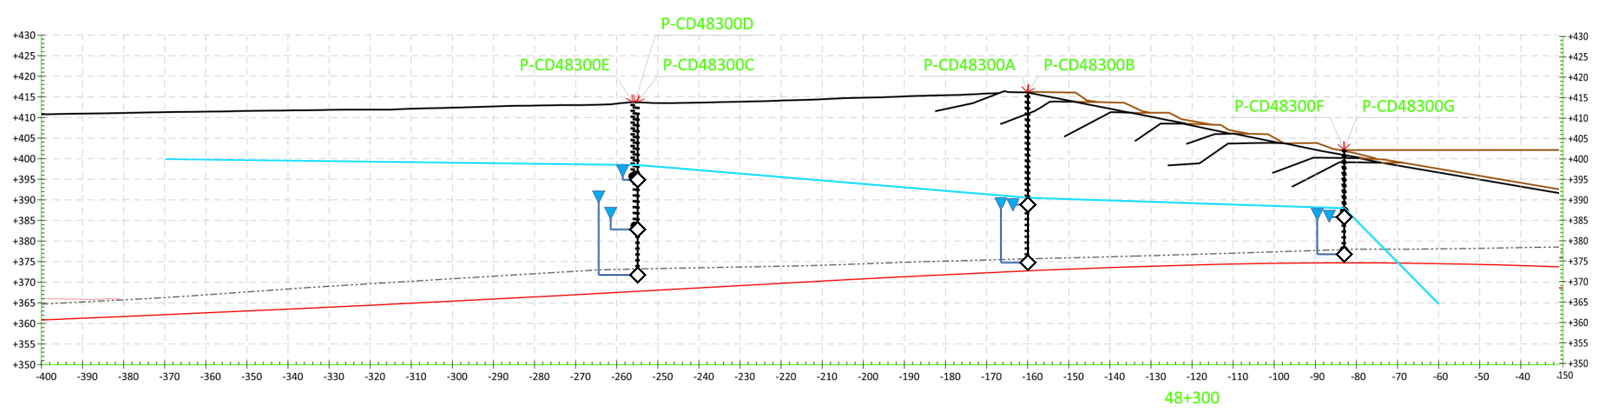
View
The Level Indicator will display the latest values for each sensor within the Real Time Display View.
The location of the sensor icon will change based on the latest reading of the sensor.
When viewing a Level Indicator you can:
- Get detailed information about a sensor by hovering over the icon.
- Click a sensor tooltip value to view historical data for that sensor variable.
- Show historical data for all piezometers belonging to the same location
- Show historical data for sensors within the trend line
Sensor tooltip
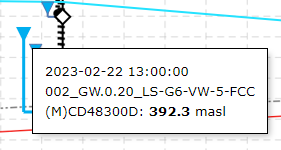

Hover over the sensor (blue triangle) to see the latest reading value. Click on the icon to keep the tooltip open (clicking again on the icon will close the tooltip). With the tooltip open, clicking on the sensor reading will open a popup graph showing the latest readings.

Hovering over the sensor installation (white diamond) will show the latest readings for the temperature and pressure sensors. If the temperature and pressure have not been selected then no tooltip is shown. Click on the icon to keep the tooltip open (clicking again on the icon will close the tooltip). With the tooltip open, clicking on the sensor reading will open a popup graph showing the latest readings.
Popup graph for every sensor in a Location
To quickly see the readings for each sensor within a location click on the location line itself. This will open a popup graph with all the location sensors preselected.
Popup graph for maximum value of all Locations
To quickly see the maximum readings for all Locations click on the level indicator line. This will open a popup graph with all the sensors preselected.