Manual
Alarm
Burst Data
Dashboard
Data Source
Manual Inclinometer
Loadsensing
Ackcio
CSI
File Import
Geokon
SAA
Sigicom
Total Stations
Waste Management
Profound
Axilog
GSS
Webcam import
Displacement Graph
GIS
Historical Graphs
Real Time Display
Virtual Variables
SSO
Setup Azure AD for VDV
Setup Single Sign-On in VDV
Single Sign-On setup checklist
Manual provider setup
Analysis
API
Contacts
Contact Groups
Completeness
Data Export Task
Documents
Download Data
Localization
Notes
Month Overview
Reports
Site Setup
QA/QC
Project
Prism
Update Overview
Users in VDV
Manual Import
Setting up a webcam
Embed API
Webcam
User interface
License Overview
Graph Configuration
Site Map
Quick View
Videos
Guides
After install action list
Install VDV on-premise
Creating a new project
Installing scheduled tasks
Restarting the Vista Data Vision System
Exporting site and unit lists from db.robot.c
Exporting the settings from the File Converter
Muting sounds in VDV
Updating VDV with the store in offline mode
Migrate/Move Vista Data Vision to a new server
FAQ
Server Side
File Converter gets empty
Update header - new sensors added to the data file
Import modified or historical data
The VI Not Executable
Email subject contains information from the mail server
Webcam not importing pictures
How to configure Text Message Service
Run tasks minimized
Units
System Requirements
Backing up VDV
Front end
How to extend VDV Timeout
System validation after PHP 8 update
- All Categories
- Manual
- Analysis
Analysis
Updated
by Ragnar Tryggvason
Analysis allows you to do a analysis on 2 or more variables such as Cross Correlation, Regression and detailed Statistics.
Select Variables & Time
Click on the + icon to select Variables and use the date picker to choose the correct timer period.
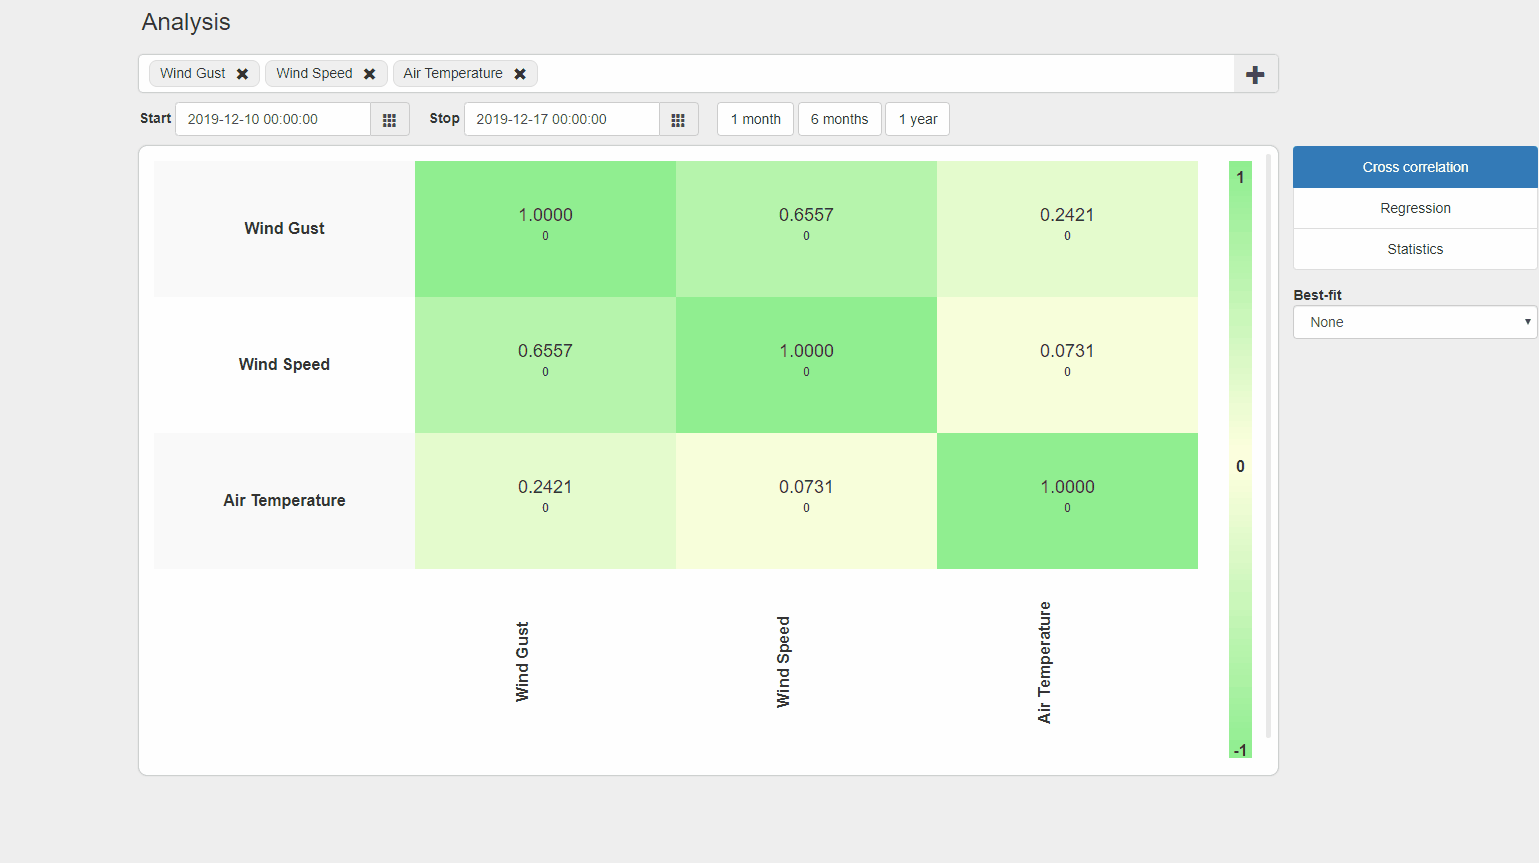
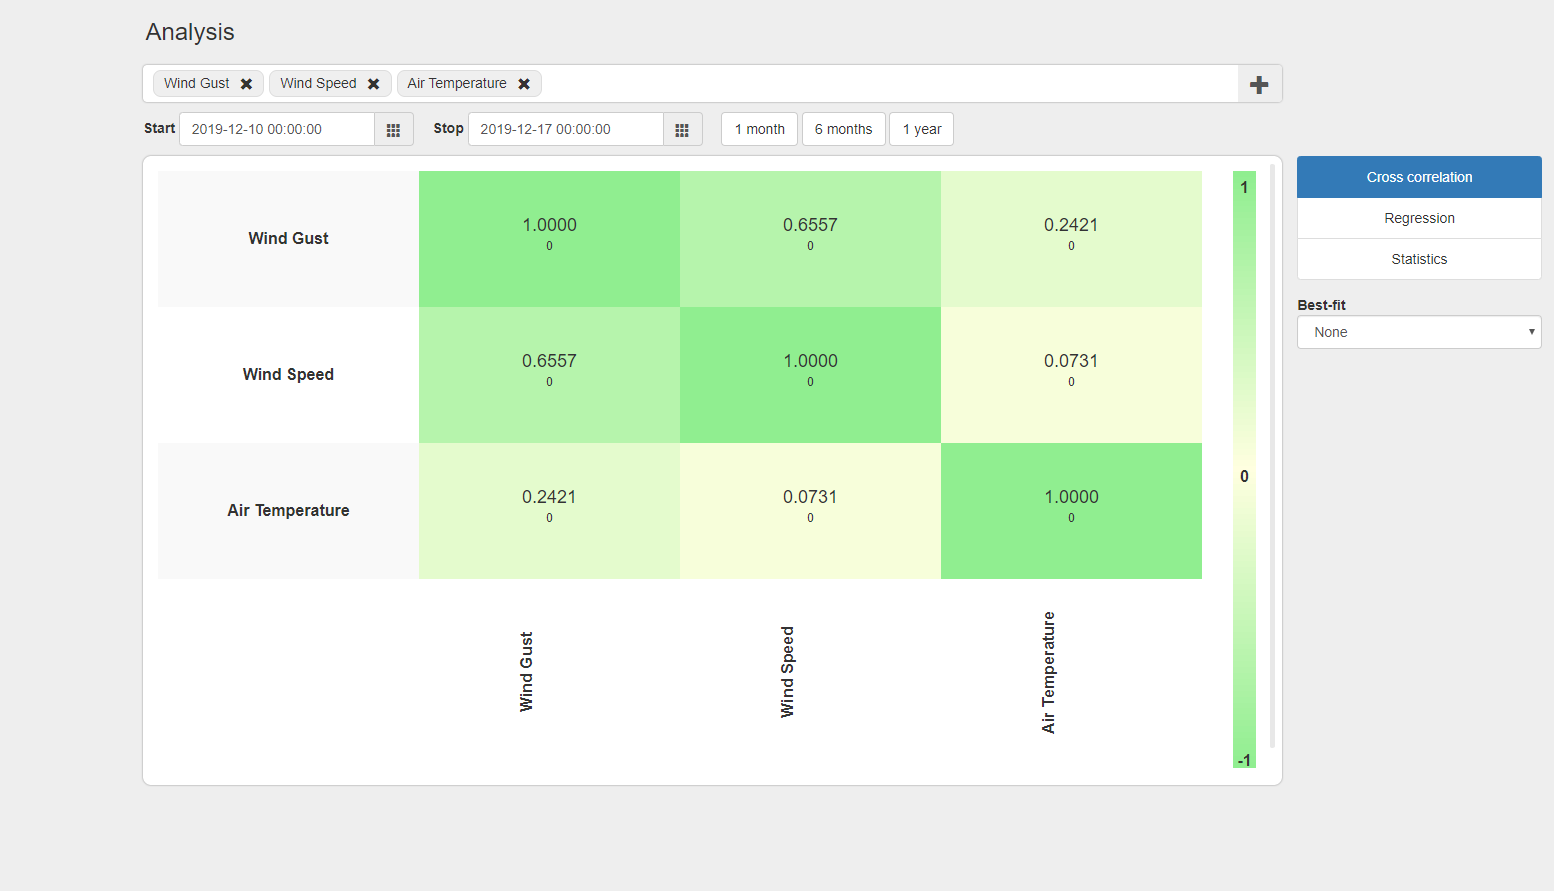
Cross Correlation
Clicking this option will display a cross correlation table for the variables selected (maximum of 5 variables).
- Each table cell represents the correlation between a pair of variables.
- Clicking on any of the cells will open up the regression component for the selected variable pair.
Best fit
Calculates the correlation between all variables within the time shift period option selected and displays the best fit value for each variable pair. It will shift variables on the X-axis ± the value selected.
If ± 20 is selected then VDV will find best match when shifting the variables on X-Axis ± 20 readings.
This is a great option when there is a delay in Correlation between variables.
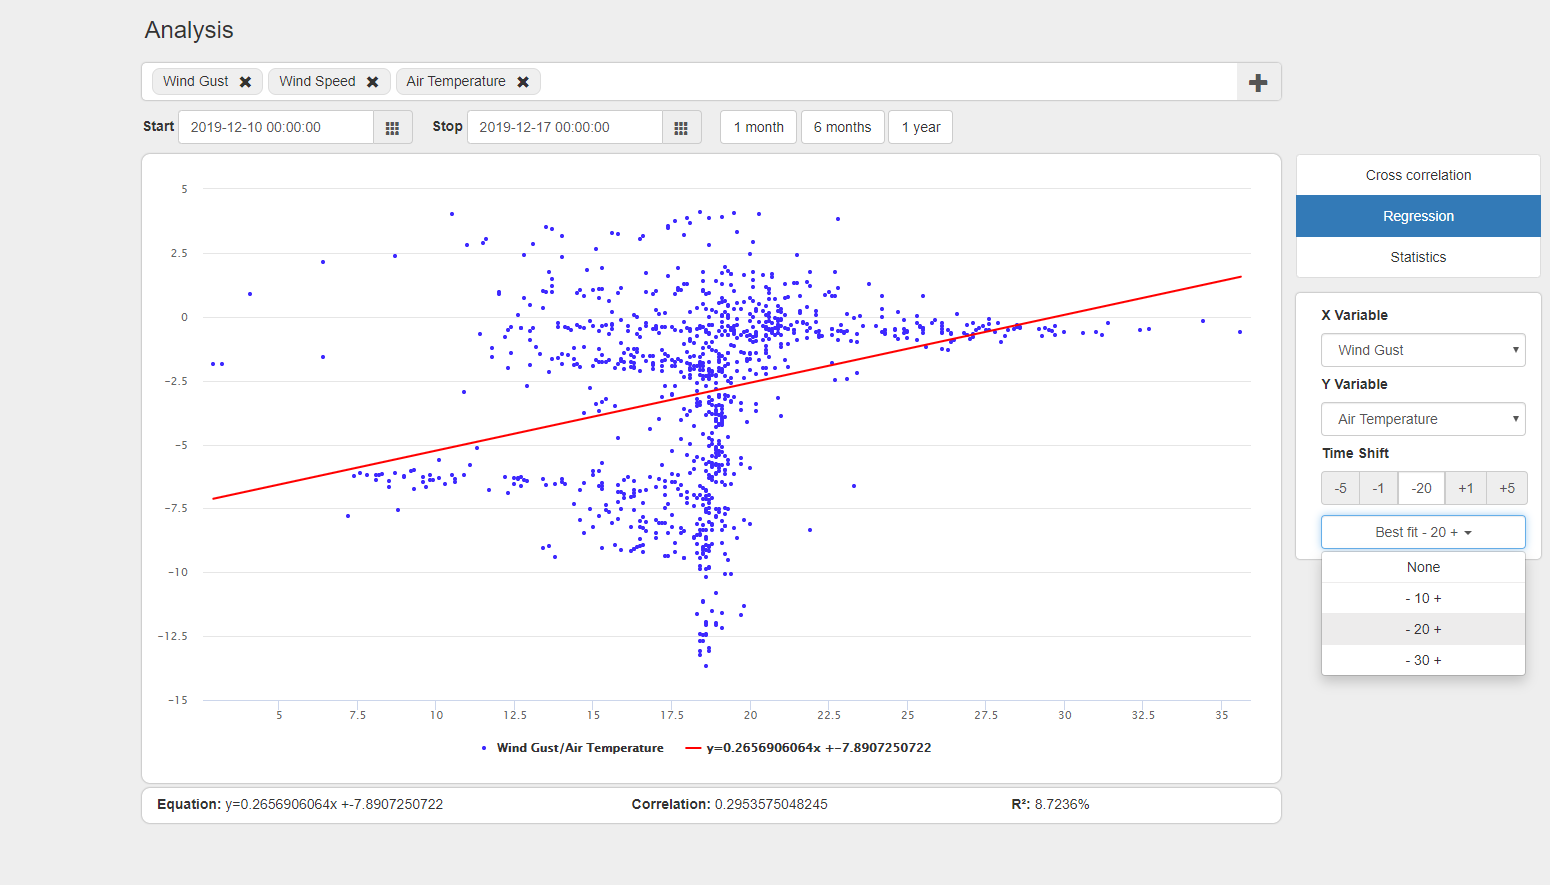
Regression
The regression option will display a scatter plot for two variables, then calculate and display a regression line.
You can easily switch between variables by navigating the X & Y Variable drop down lists on the right hand side.
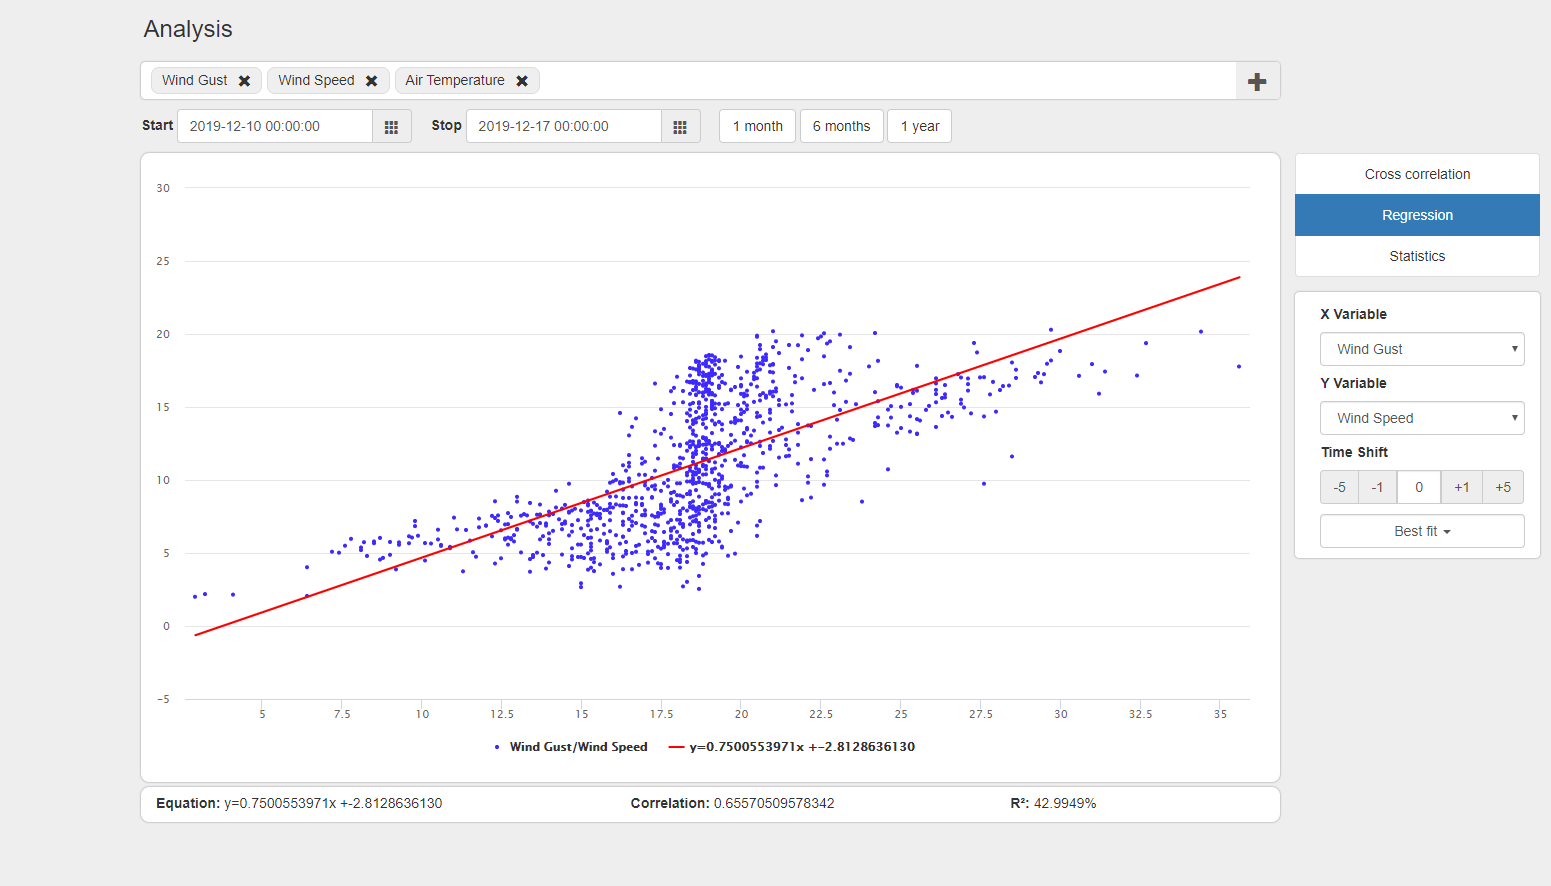
Time Shift
Same as Best Fit but you can manually shift the data.
Shifts the data for the X variable by number of readings selected. Meaning if -5 is selected for Time Shift the the X variable is shifted backwards for 5 readings.
Best Fit
Calculates the correlation between all variables within the time shift period option selected and displays the best fit value for each variable pair. It will shift variables on the X-axis ± the value selected.
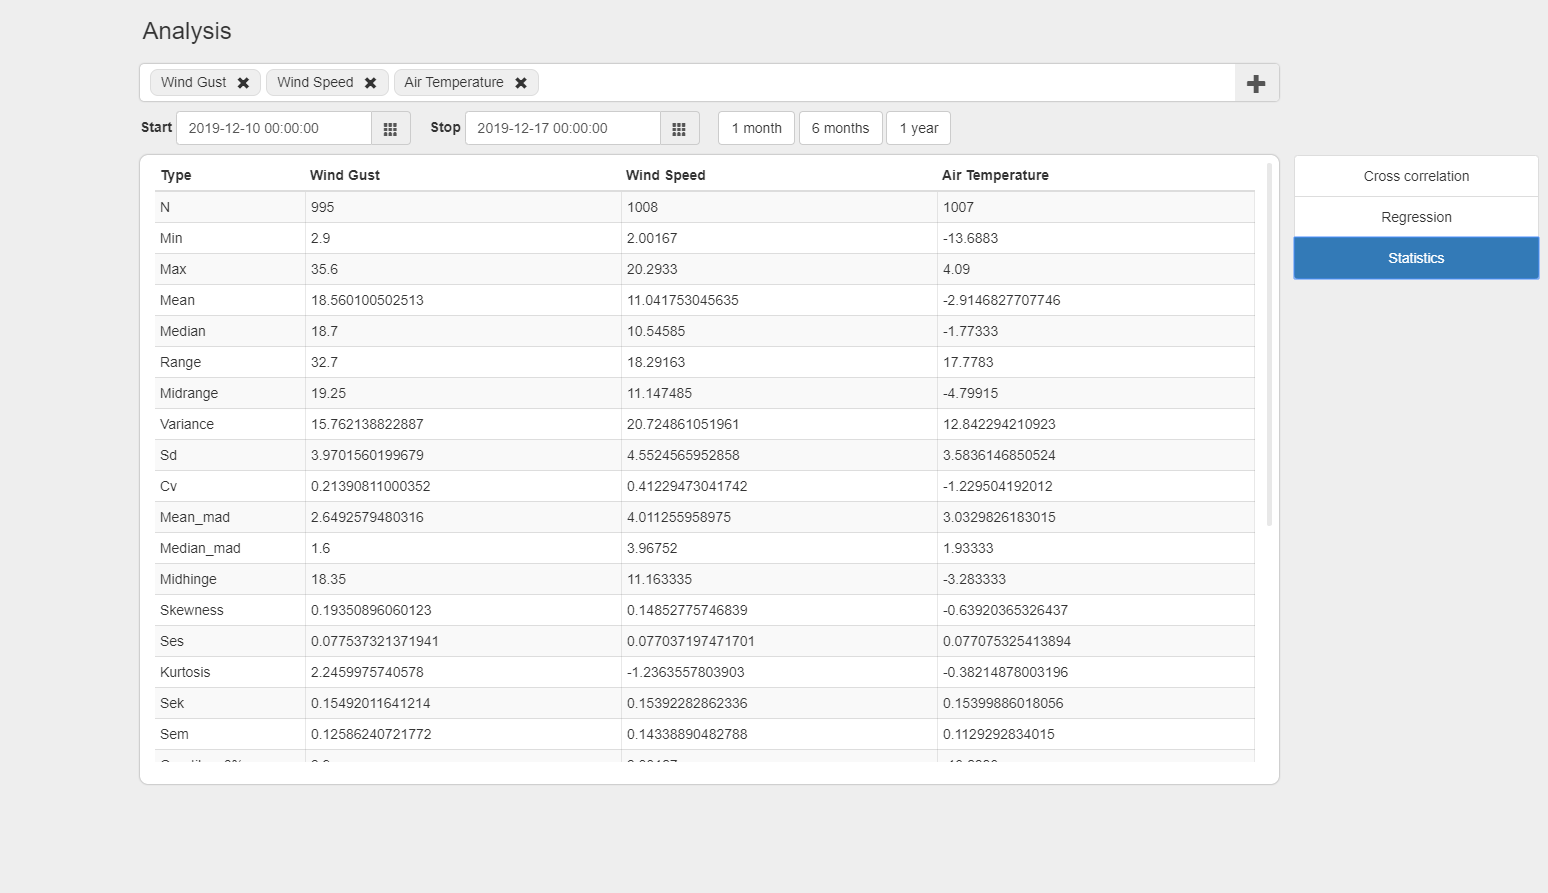
Statistics
The statistics option will display detailed statistics for each variable for the selected time period.