Manual
Alarm
Burst Data
Dashboard
Data Source
Manual Inclinometer
Loadsensing
Ackcio
CSI
File Import
Geokon
SAA
Sigicom
Total Stations
Waste Management
Profound
Axilog
GSS
Webcam import
Displacement Graph
GIS
Historical Graphs
Real Time Display
Virtual Variables
SSO
Setup Azure AD for VDV
Setup Single Sign-On in VDV
Single Sign-On setup checklist
Manual provider setup
Analysis
API
Contacts
Contact Groups
Completeness
Data Export Task
Documents
Download Data
Localization
Notes
Month Overview
Reports
Site Setup
QA/QC
Project
Prism
Update Overview
Users in VDV
Manual Import
Setting up a webcam
Embed API
Webcam
User interface
License Overview
Graph Configuration
Site Map
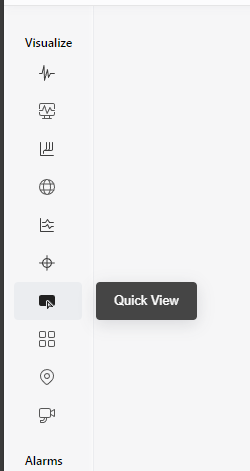
Quick View
Videos
Guides
After install action list
Install VDV on-premise
Creating a new project
Installing scheduled tasks
Restarting the Vista Data Vision System
Exporting site and unit lists from db.robot.c
Exporting the settings from the File Converter
Muting sounds in VDV
Updating VDV with the store in offline mode
Migrate/Move Vista Data Vision to a new server
FAQ
Server Side
File Converter gets empty
Update header - new sensors added to the data file
Import modified or historical data
The VI Not Executable
Email subject contains information from the mail server
Webcam not importing pictures
How to configure Text Message Service
Run tasks minimized
Units
System Requirements
Backing up VDV
Front end
How to extend VDV Timeout
System validation after PHP 8 update
- All Categories
- Manual
- Quick View
Quick View
Updated
by Ragnar Tryggvason
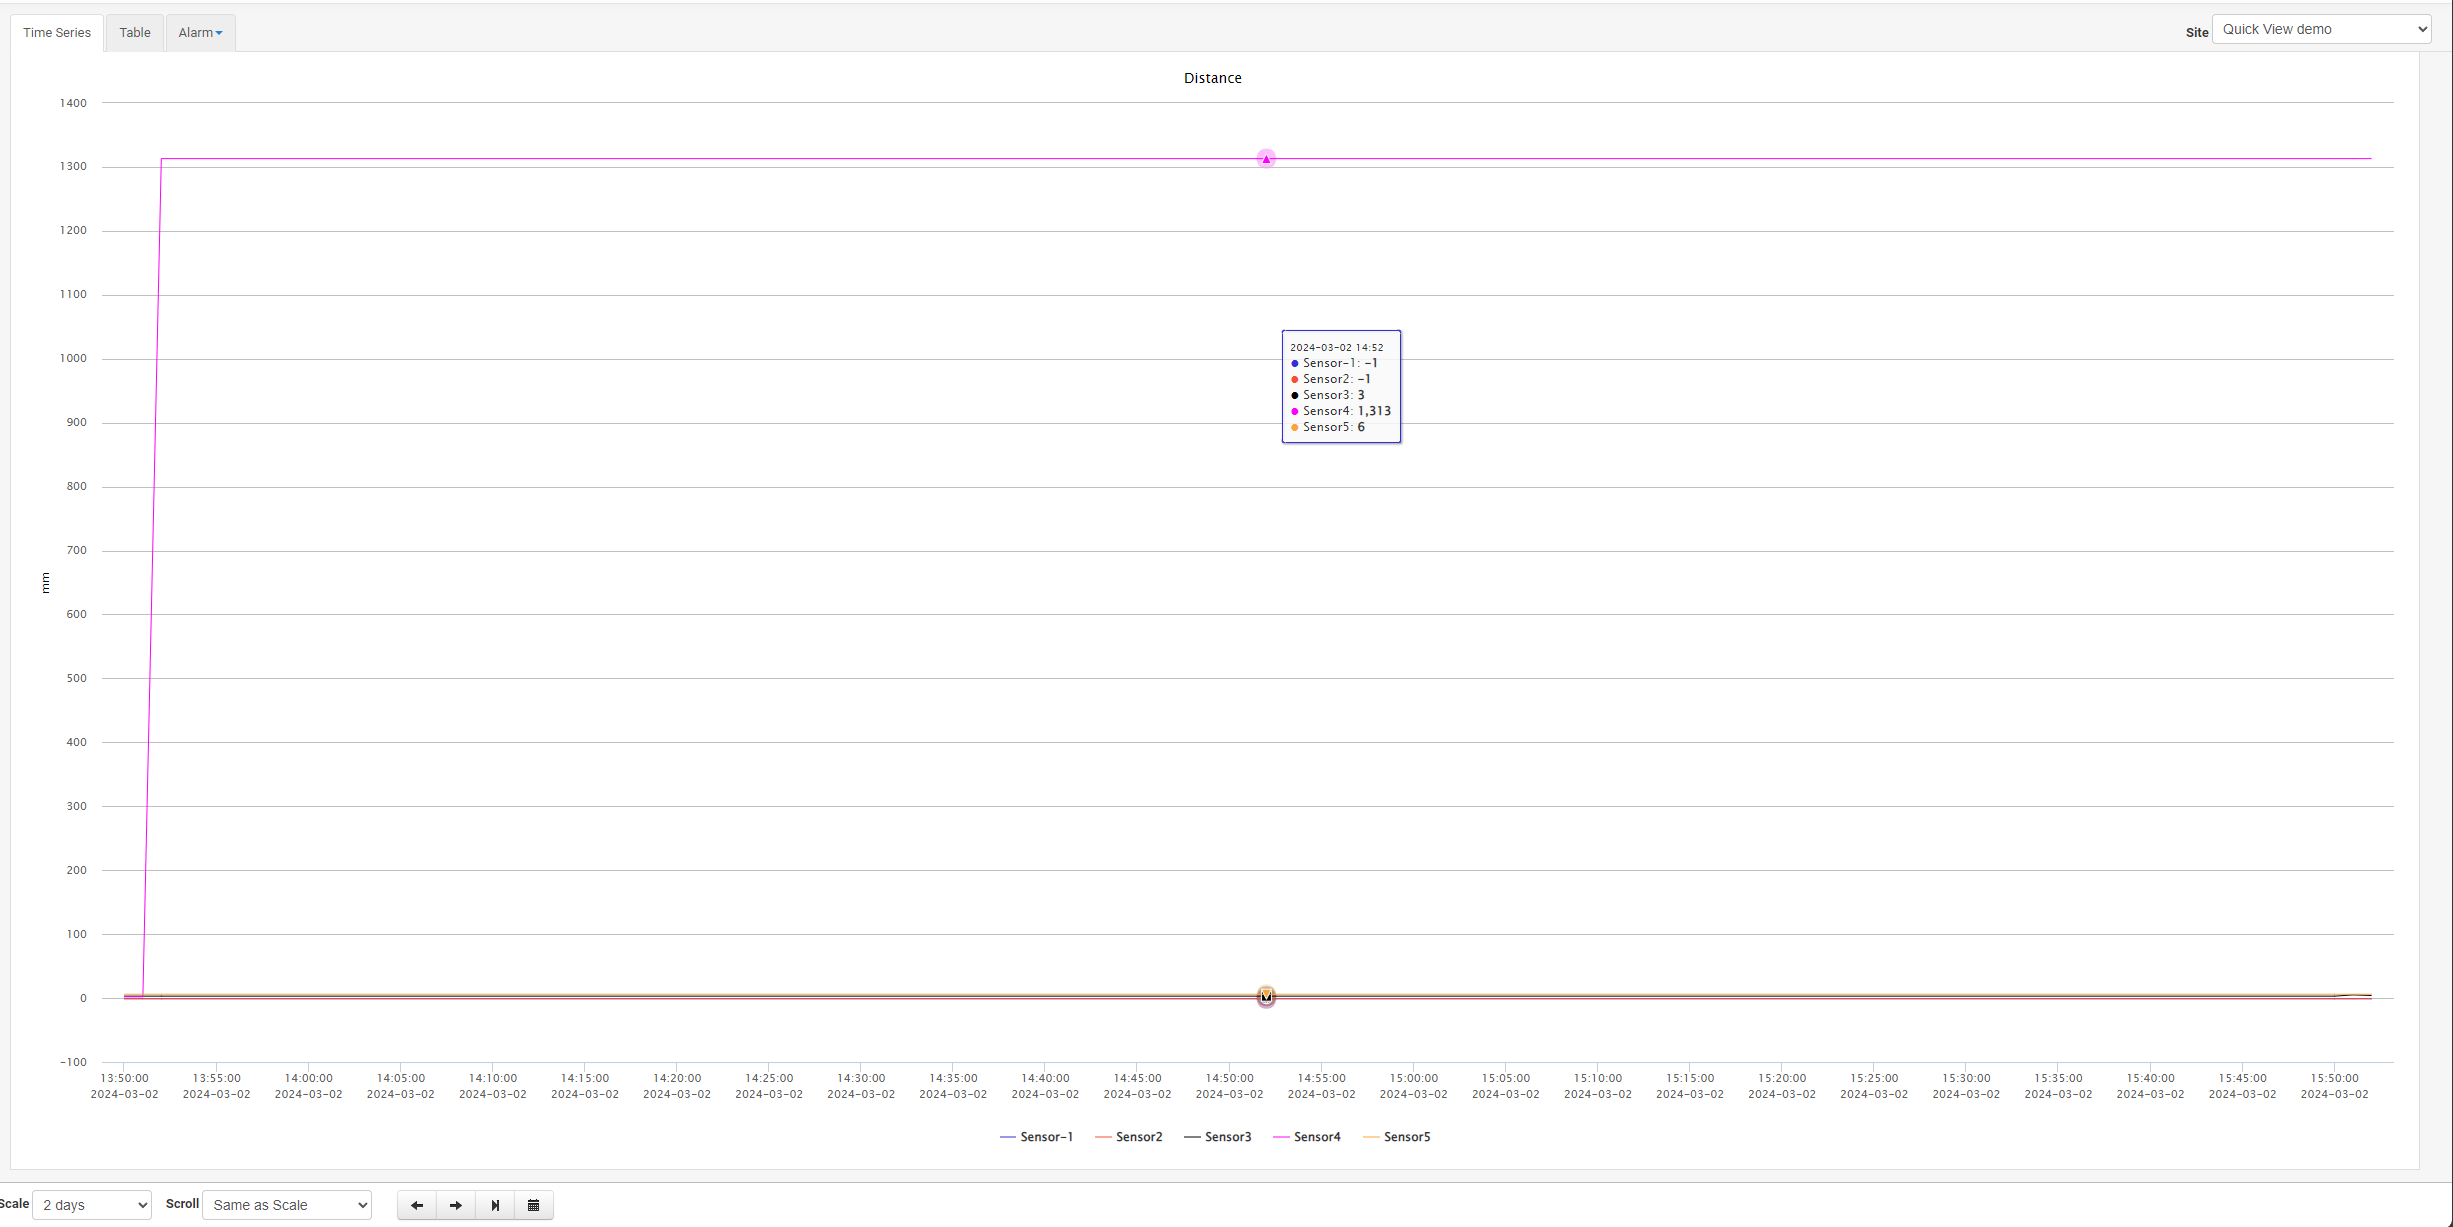
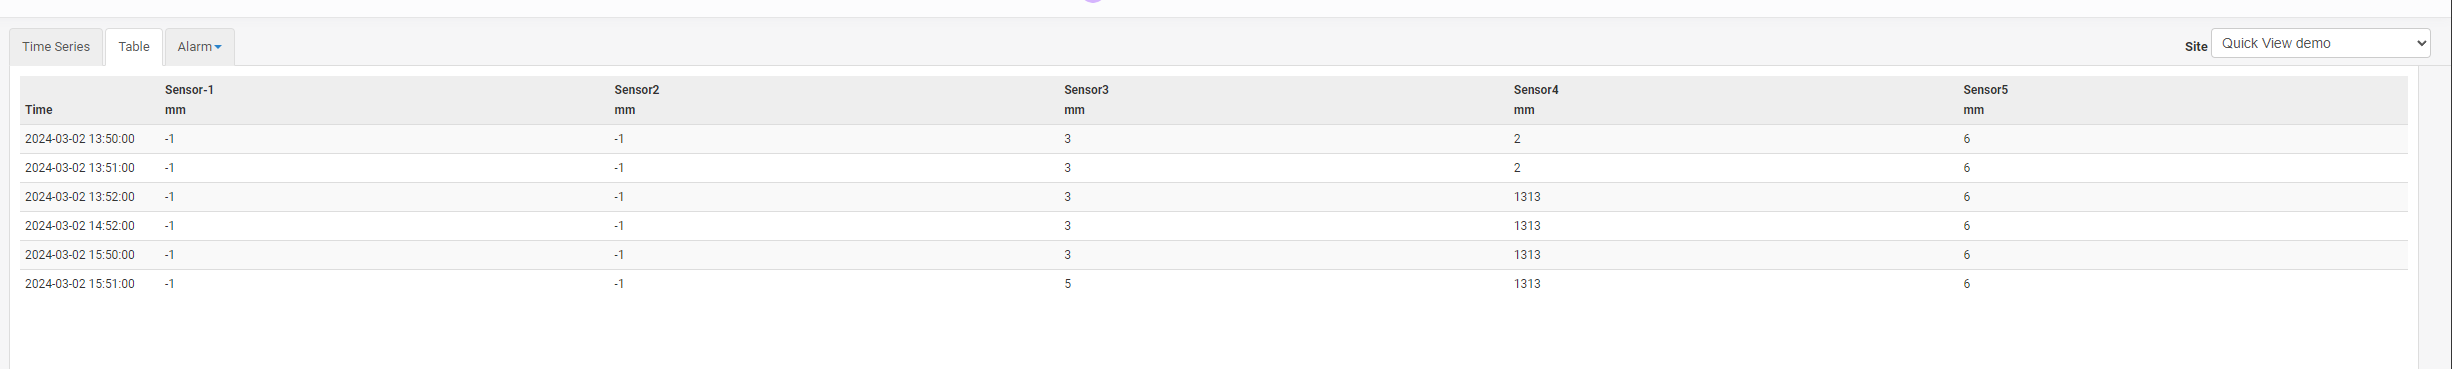
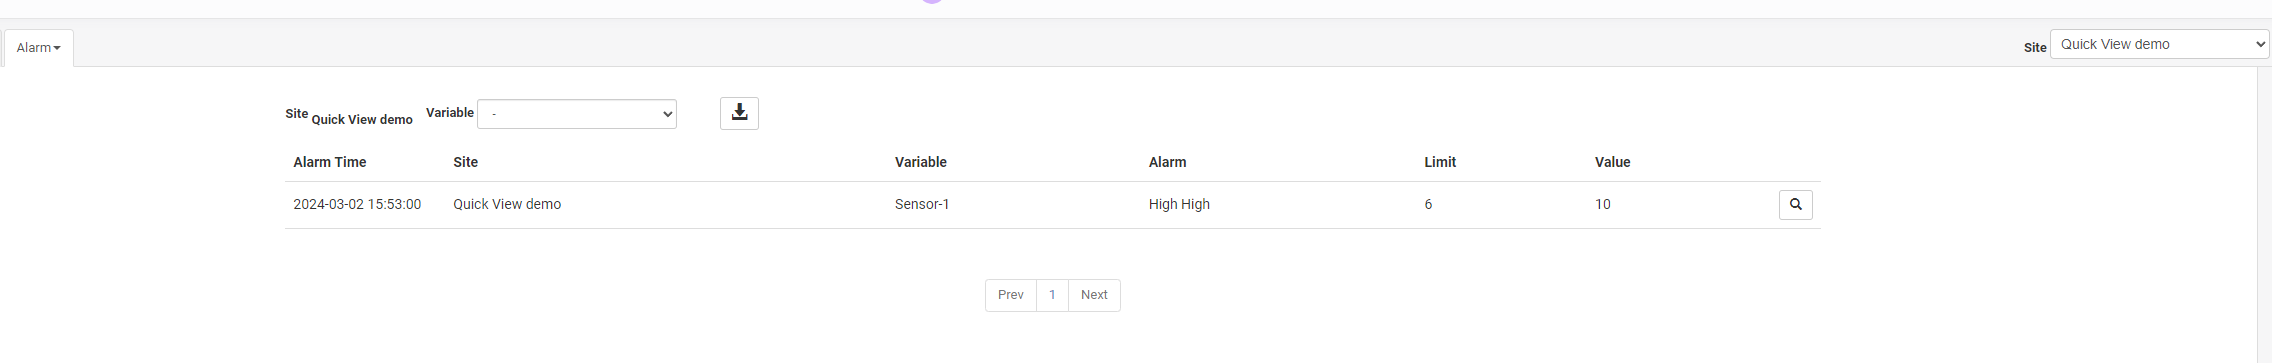
Quick View is a useful feature to quickly check values for variables in a site. In Quick View you can see table values, graphs, active alarms and alarm logs.
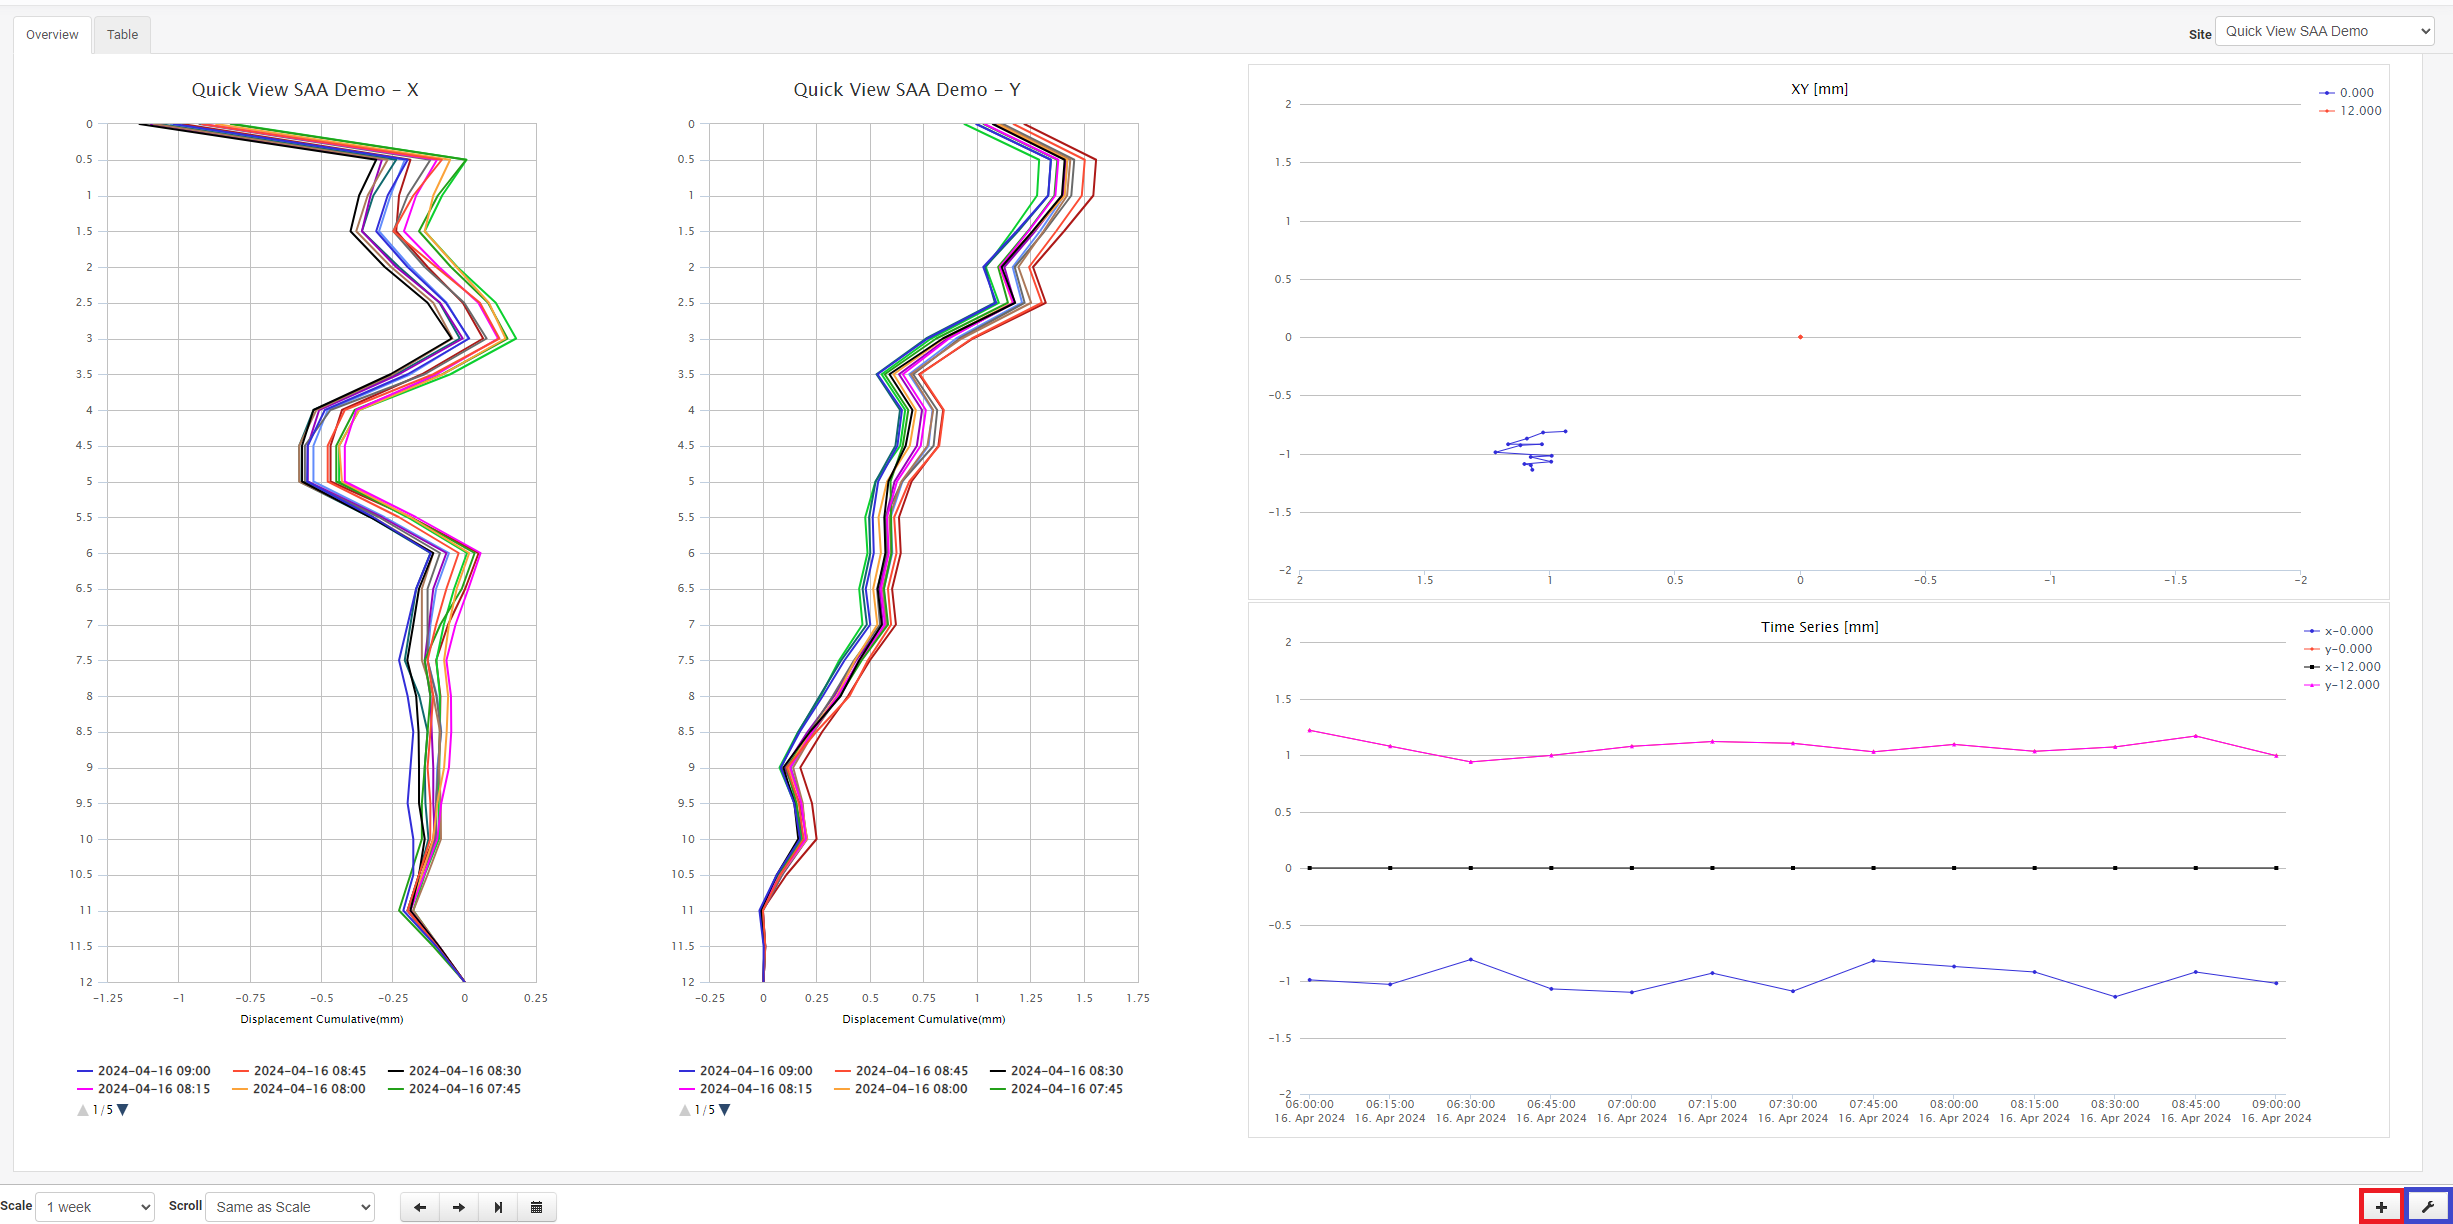
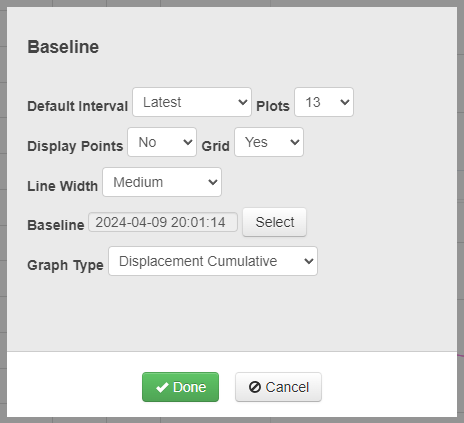
Quick View also offers a quick setup for SAA/Displacement installations. With Quick View SAA you can see both axis for the SAA, quickly configure the baseline, calculation types and you can also see the time series for individual segments of the SAA.
Using Quick View
You start by going into Quick View in the left menu.
There you can select your site and view the data for it. Down in the bottom left you can select the time period or manually select dates.

Configuring SAA Quick View
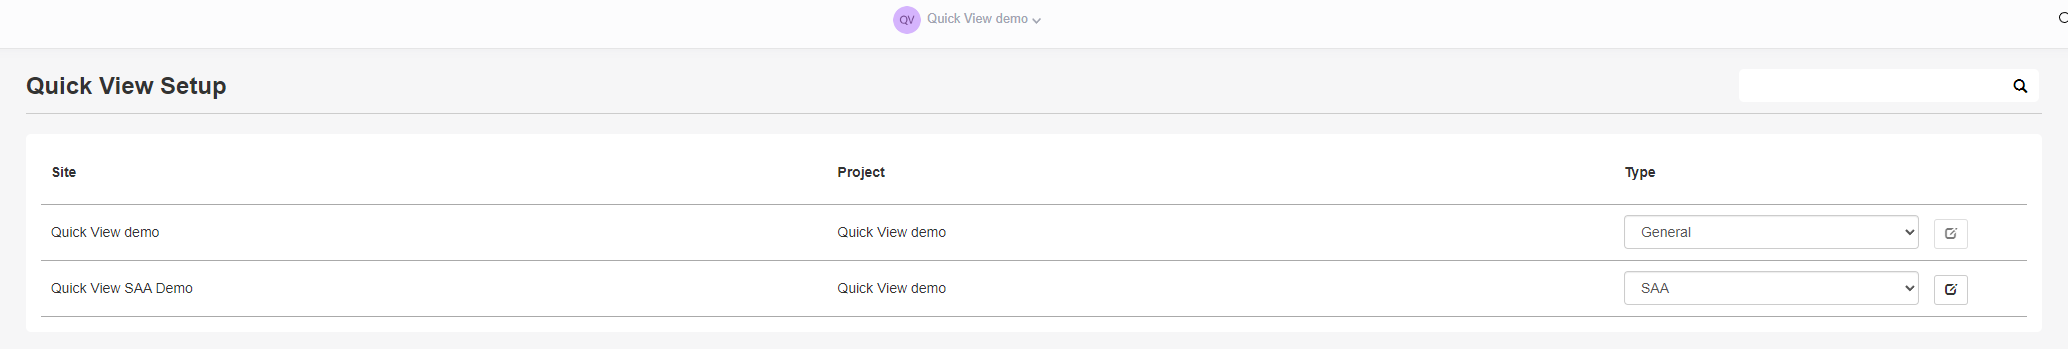
To configure a site to have a SAA Quick View go to Setup -> Quick View.
There you can set a site as a SAA site for Quick View and edit its setup.
Once in setup, you can configure the length of the array and which variables correspond to which axis.
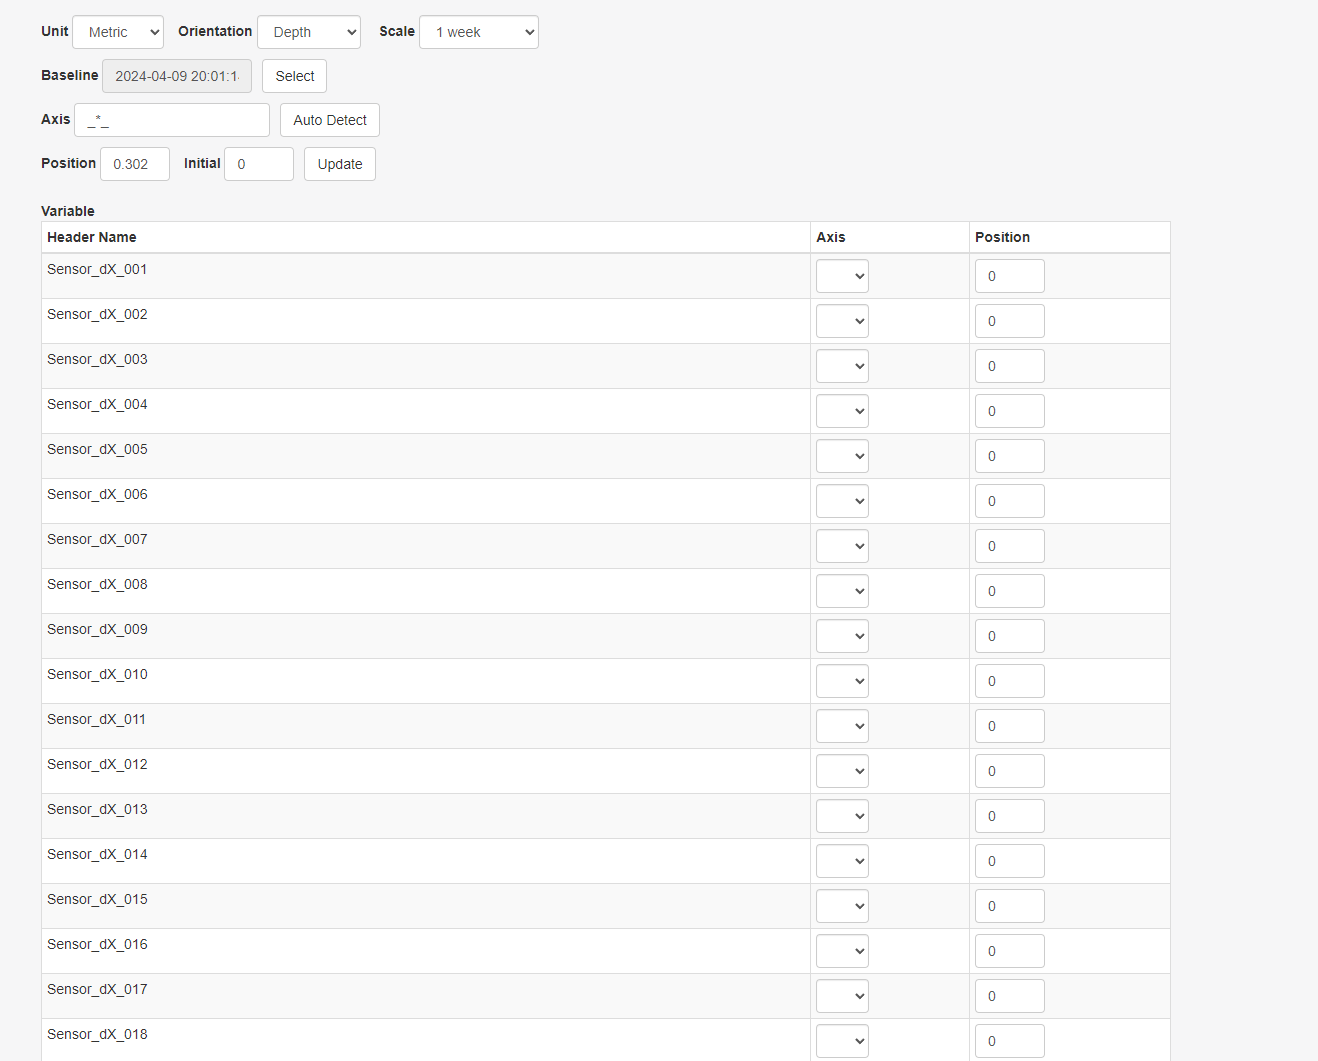
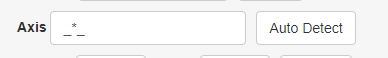
First step is to enter your characters for the wildcard search, by default it's _*_ , which means that it will look for the axis name in-between two underscores.
In the demo site, the axis names are _d*_ .
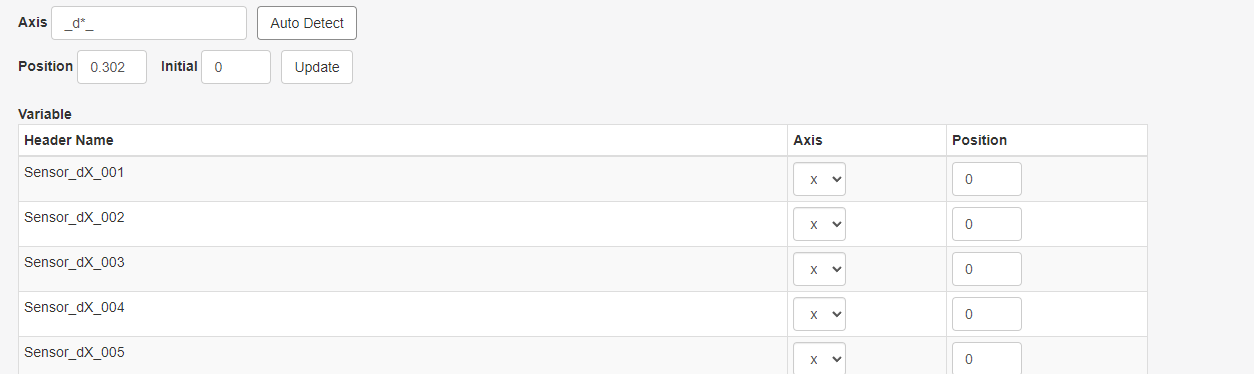
Then the next step is to set the position/depth/length of the array. This is done by changing the "position" field to your segment length.
In the demo case the segment length is 0.5 meters.
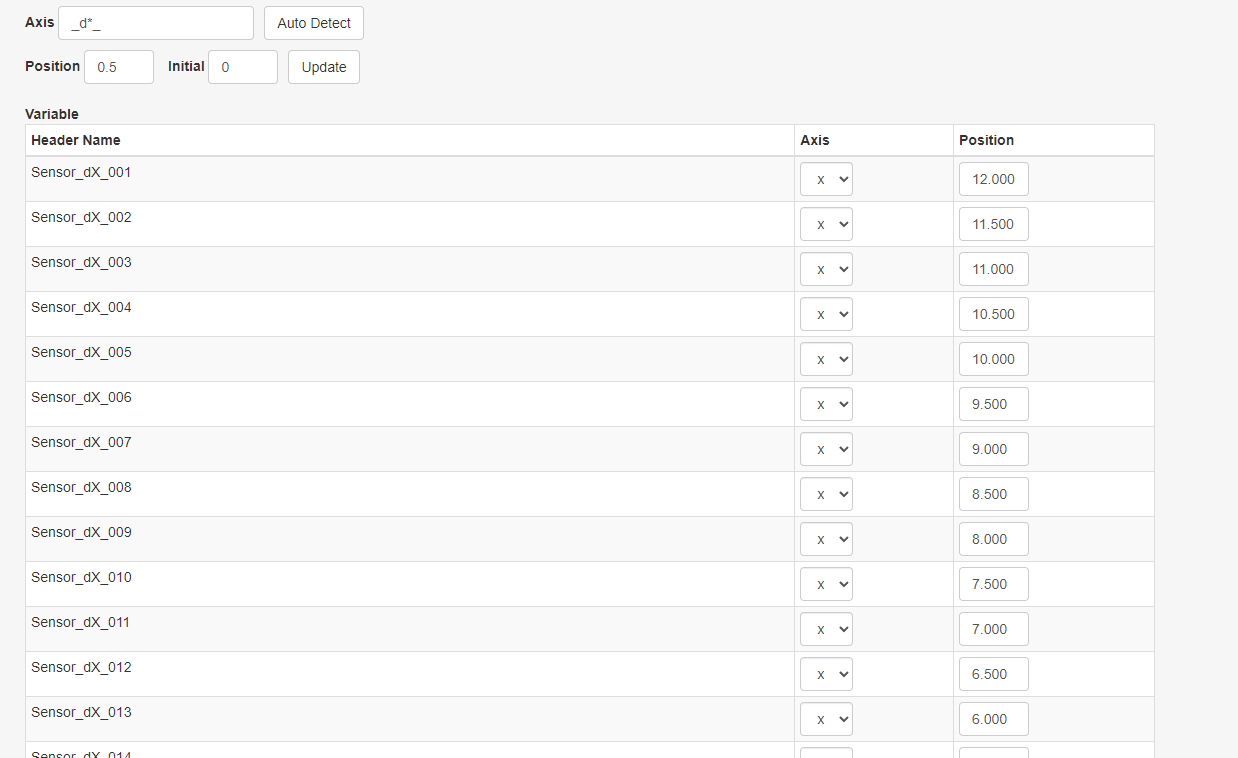
Next you scroll down and click "Update".
This will both create two displacement graphs for you in the Displacement Graphs view and also configure the site as an SAA type in Quick View.
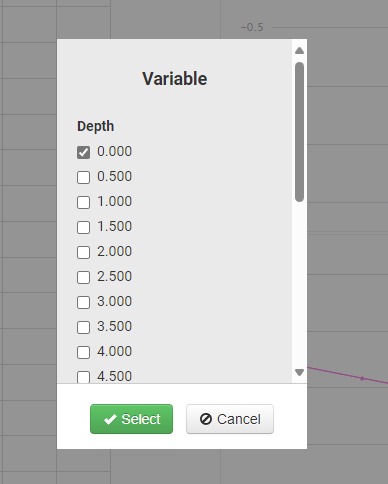
In Quick View you can configure which variables you want to be displayed in the Time Series and you can also configure your view for the Quick View Displacement Graph.