Manual
Alarm
Burst Data
Dashboard
Data Source
Manual Inclinometer
Loadsensing
Ackcio
CSI
File Import
Geokon
SAA
Sigicom
Total Stations
Waste Management
Profound
Axilog
GSS
Webcam import
Displacement Graph
GIS
Historical Graphs
Real Time Display
Virtual Variables
SSO
Setup Azure AD for VDV
Setup Single Sign-On in VDV
Single Sign-On setup checklist
Manual provider setup
Analysis
API
Contacts
Contact Groups
Completeness
Data Export Task
Documents
Download Data
Localization
Notes
Month Overview
Reports
Site Setup
QA/QC
Project
Prism
Update Overview
Users in VDV
Manual Import
Setting up a webcam
Embed API
Webcam
User interface
License Overview
Graph Configuration
Site Map
Quick View
Videos
Guides
After install action list
Install VDV on-premise
Creating a new project
Installing scheduled tasks
Restarting the Vista Data Vision System
Exporting site and unit lists from db.robot.c
Exporting the settings from the File Converter
Muting sounds in VDV
Updating VDV with the store in offline mode
Migrate/Move Vista Data Vision to a new server
FAQ
Server Side
File Converter gets empty
Update header - new sensors added to the data file
Import modified or historical data
The VI Not Executable
Email subject contains information from the mail server
Webcam not importing pictures
How to configure Text Message Service
Run tasks minimized
Units
System Requirements
Backing up VDV
Front end
How to extend VDV Timeout
System validation after PHP 8 update
- All Categories
- Manual
- Reports
Reports
The Reports tab in VDV gives user the ability to easily and quickly generate reports for their projects with all the relevant data.
- From the overview menu select Reports

- In the top right corner select the
 symbol to start a new report
 - Select the new page
 symbol at the top of the page to add another page to the report.
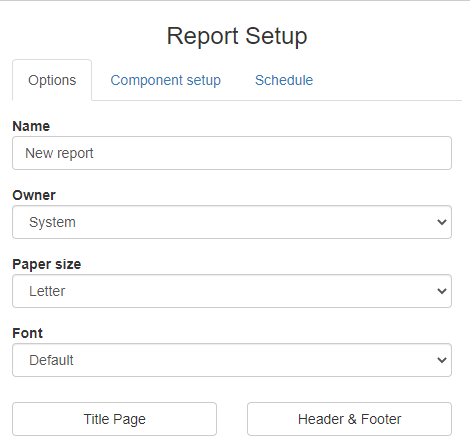
Give the Report a Name, Owner, and select paper size and font in the Report Setup.
- Click on Title Page to edit.
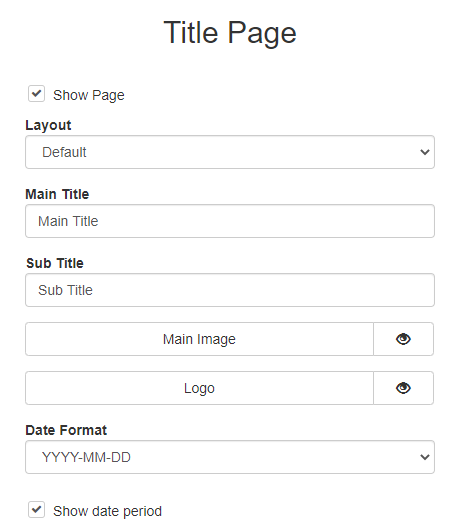
Here the user can select Layout, give the Report both a main title and subtitle, insert an image and logo, and choose the date format for the report.
- Select close at the bottom to return to the Report Setup page.
- Click on Header & Footer to open the Header & Footer menu.
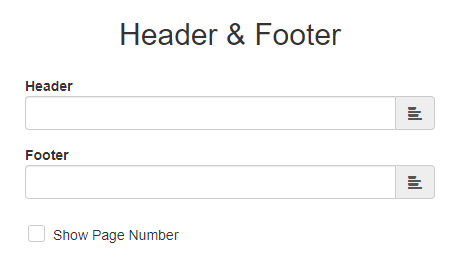
- Select close at the bottom to return to the Report Setup.
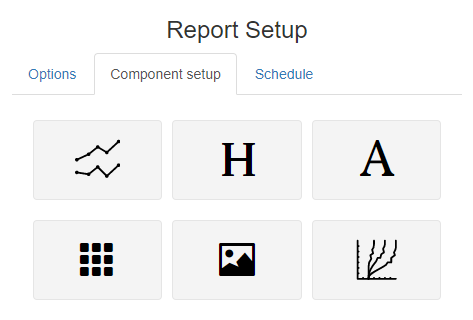
Under Component setup, the user can add graphs, tables, heading, image, text and, displacement graph. by simply using the drag and drop method.
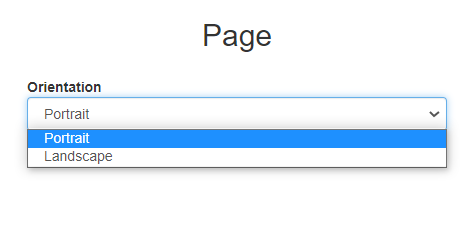
- By clicking on the margins of the page the user can select to have the selected page either landscape or portrait.
- Select Schedule in the Report Setup to schedule a regular automatic report update
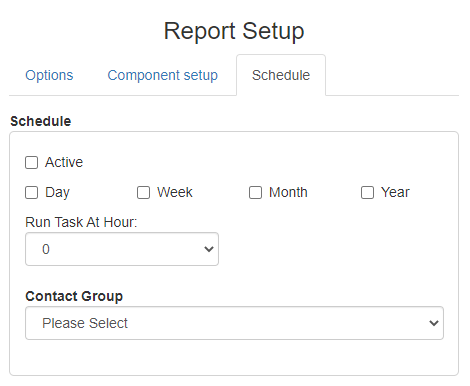
Select Activate to make the report active
Select how often the report should be sent, keep in mind that it is possible to have a daily, weekly, monthly and yearly all at the same time.
Select the Contact group (How to create a contact group) that will receive the report.
- Finally click save at the bottom of the menu to save and finish the report.