Table of Contents
Displacement Graph
Updated
by Ragnar Tryggvason
Displacement graphs can be created and configured in VDV.
Configuring
To configure displacement graphs to Setup -> Displacement Graph.

Click + in the top right corner to create a new Displacement Graph.
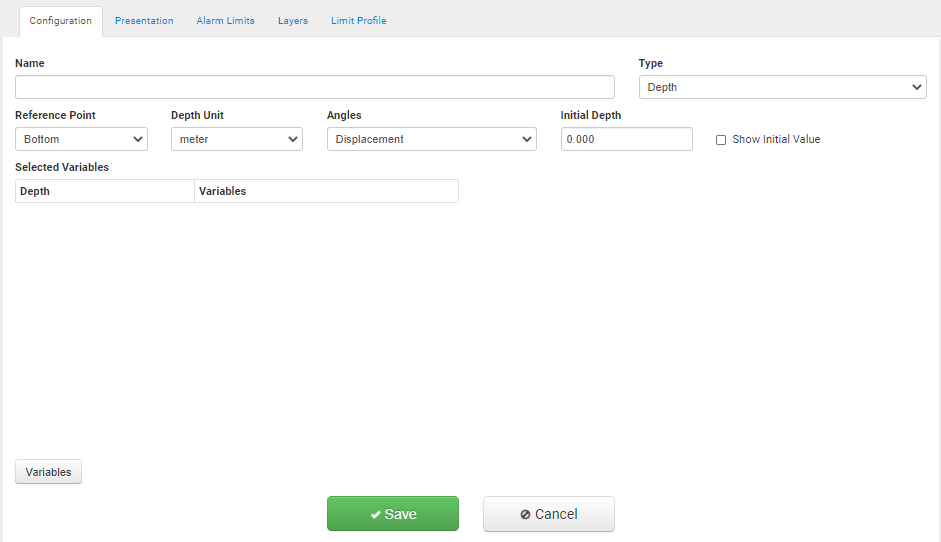
Give the Displacement graph a name and add the type (Depth, Distance, Elevation and Convergence graphs).
Add the reference point (top or bottom).
Choose Depth Unit (Meters or Feet).
Angles (Displacement, Angles, Sin(Ang)).
Adding Variables
Click  to add variables to the Graph.
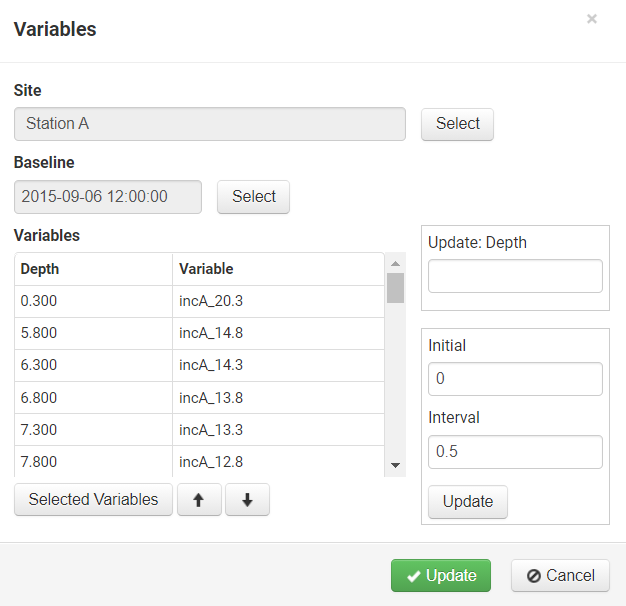
Select the Site where the data is stored.
Select the Baseline reading.
Click Select Variables to add Variables to the graph.
Use the controls on the right-hand side to set the location of each Variable.
Configuration Tab
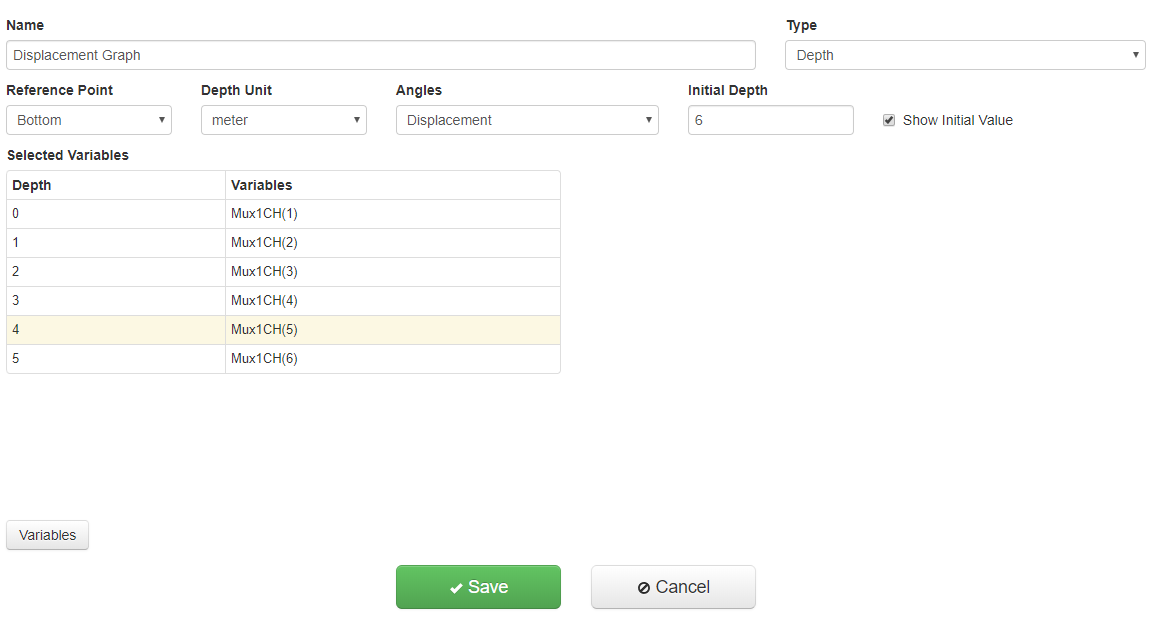
The Initial Depth is optional and will add an Anchor to the graph.
The reference Point (Bottom/Top) tells VDV where to start to calculate the Cumulative movement.
- Bottom=Largest Number.
- Top=Smallest number.
Presentation tab
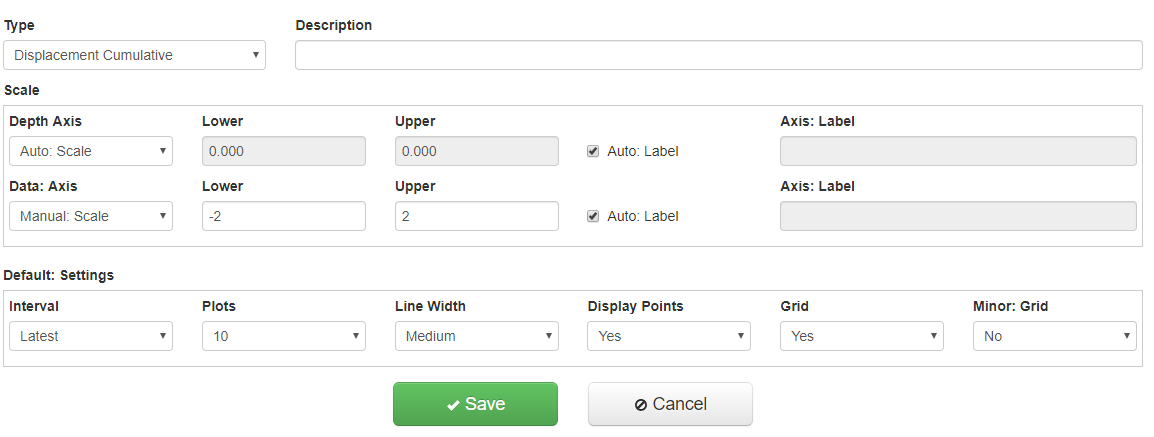
Choose Graph type.
Displacement Cumulative = VDV Calculates Cumulative Displacement and subtracts the baseline reading.
Displacement Incremental = Incremental Displacement where the baseline is subtracted.
Deviation Cumulative = VDV Calculates Cumulative Displacement but does not subtract the baseline reading.
Deviation Incremental = VDV Displays the data as it is without any calculations.
- It is optional to set the Depth and X Scale.
- It is optional to change how many plots are shown on the graph. Default is to show the latest 10 plots.
Alam Tab
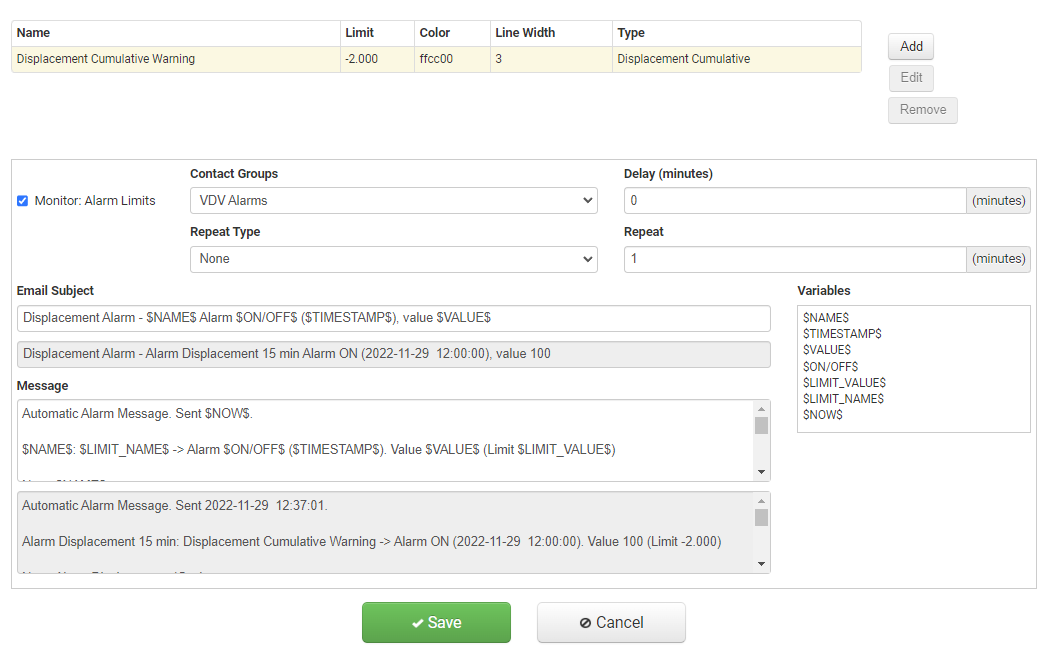
It is possible to add multiple alarm limits and choose custom colors and line widths and other features.
Click the add button to create a new alarm limit.
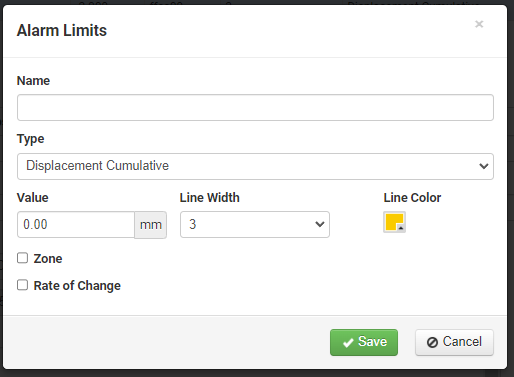
- Name: The name of the alarm limit
- Type: Displacement Cumulative & Incremental and Deviation Cumulative & Incremental.
- Value: The alarm value
- Line With: Width of the line on the displacement graph
- Line Color: Color of the line on the displacement graph
- Zone: This will enable the zone alarm option
- Rate of Change: This will enable the Rate of Change alarm option.
Zone Alarms
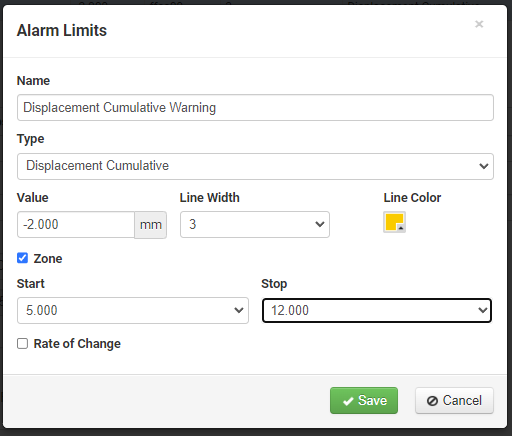
Zone alarms allow you to set different alarms for different depths/distances.
The start and stop options are configured in the Configuration panel when selecting variables and depths/distances.
Rate of Change
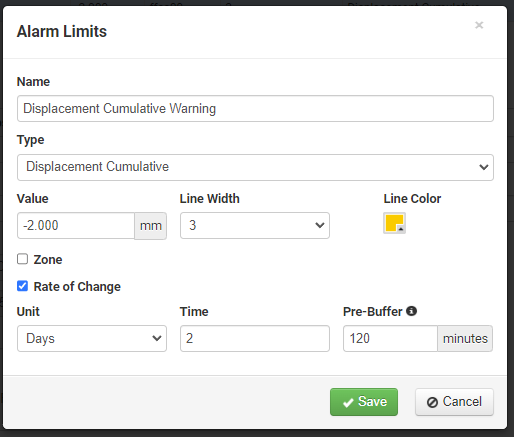
- Unit: Minutes, Hours or Days
- Time: Number of units, e.g. 2 Days.
- Pre-Buffer (in minutes): If the pre-buffer is set timestamps will be included that are within the limits of the buffer e.g.
RoC is 60 minutes, the buffer is 15 minutes, and the current time is 12:00
The expected time would be 11:00, but it does not exist
There exist data for 10:50
In this case, we would use 10:50 since it is within the 15 minutes buffer
If the buffer was not set, no valid data would have been found
Layers Tab
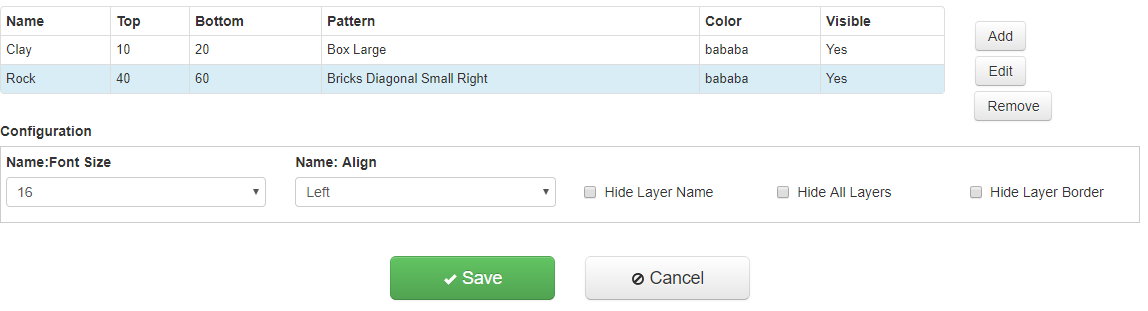
Adding layers is done through the Layers Tab by selecting the Add button.
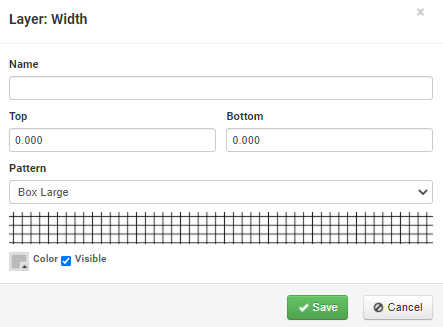
Give the layer a name and the appropriate configuration in width, select the pattern and color scheme and click Save.
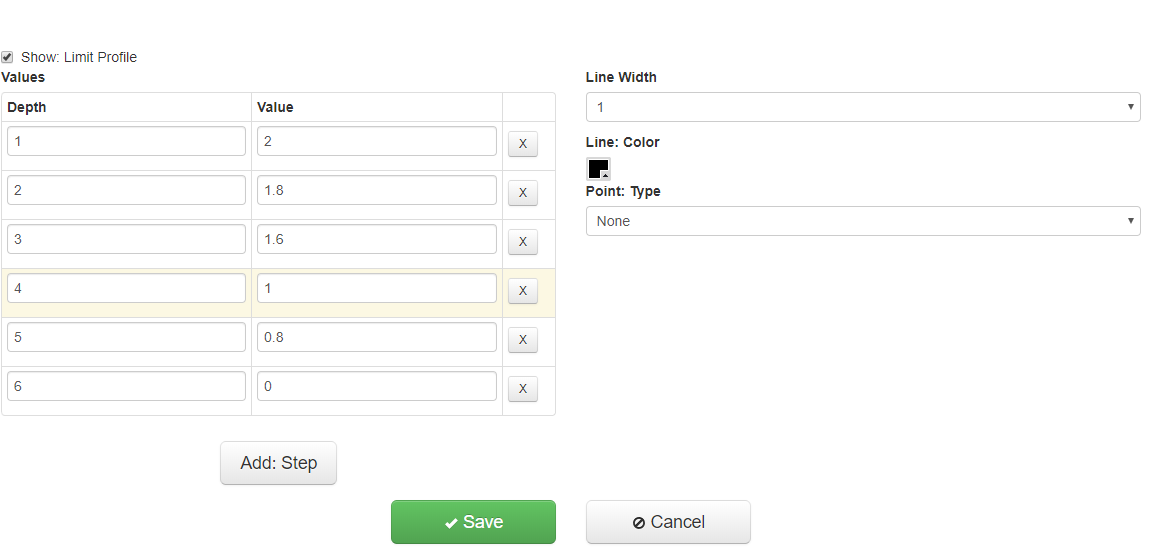
Limit Profile
The Limit Profile gives the user a chance to draw up a comparison line on the graph that can be visually compared to the data.
Convergence
It is also possible to view SAA convergence data on the displacement graph.
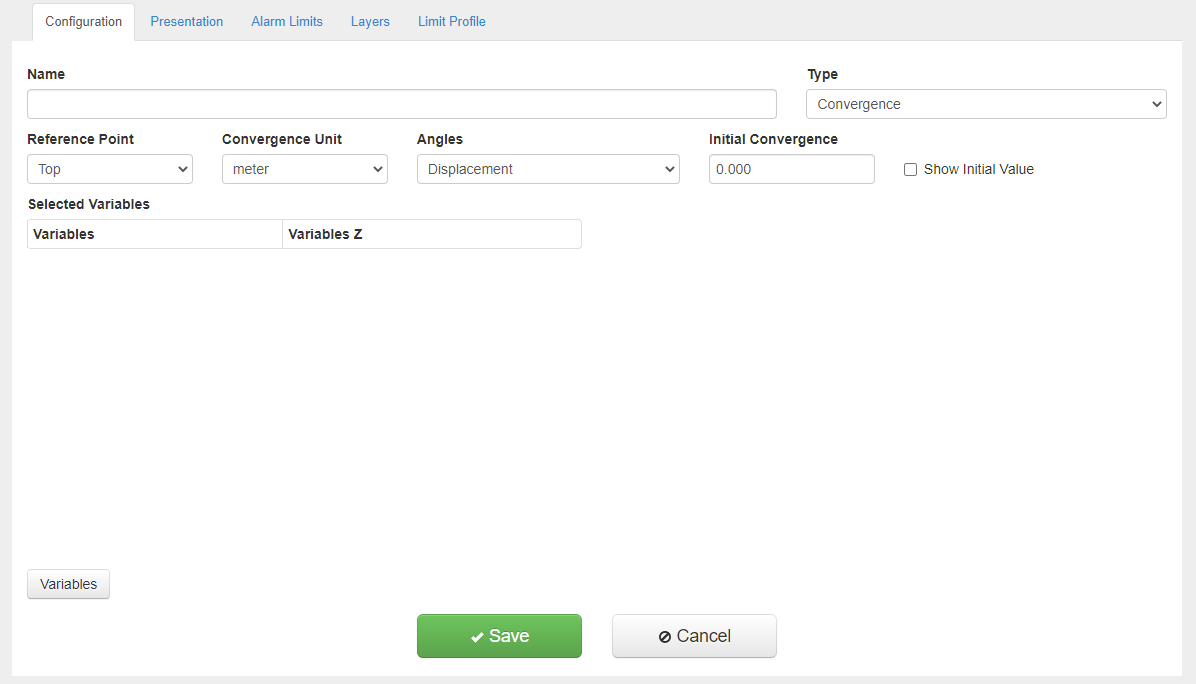
Under the Configuration tab, select Convergence as the Type of displacement graph and select the Reference point as Top.
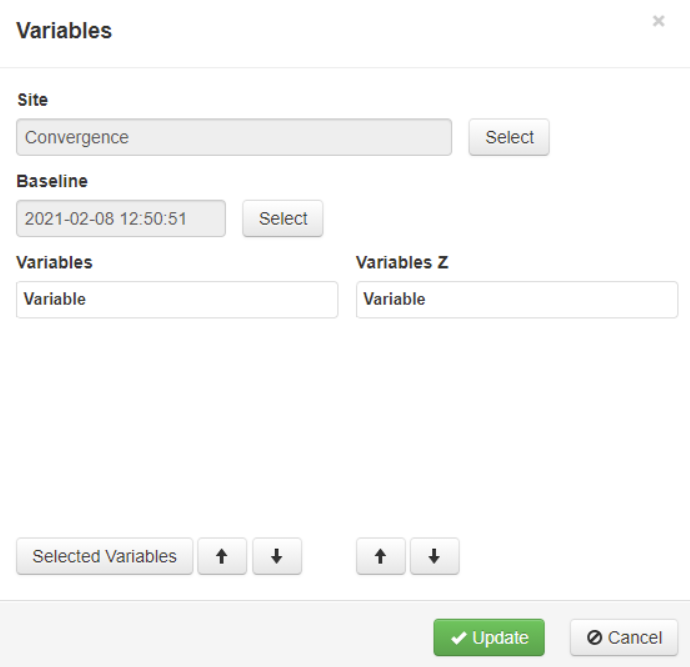
Select site and baseline, just like when creating vertical or horizontal displacement graphs.
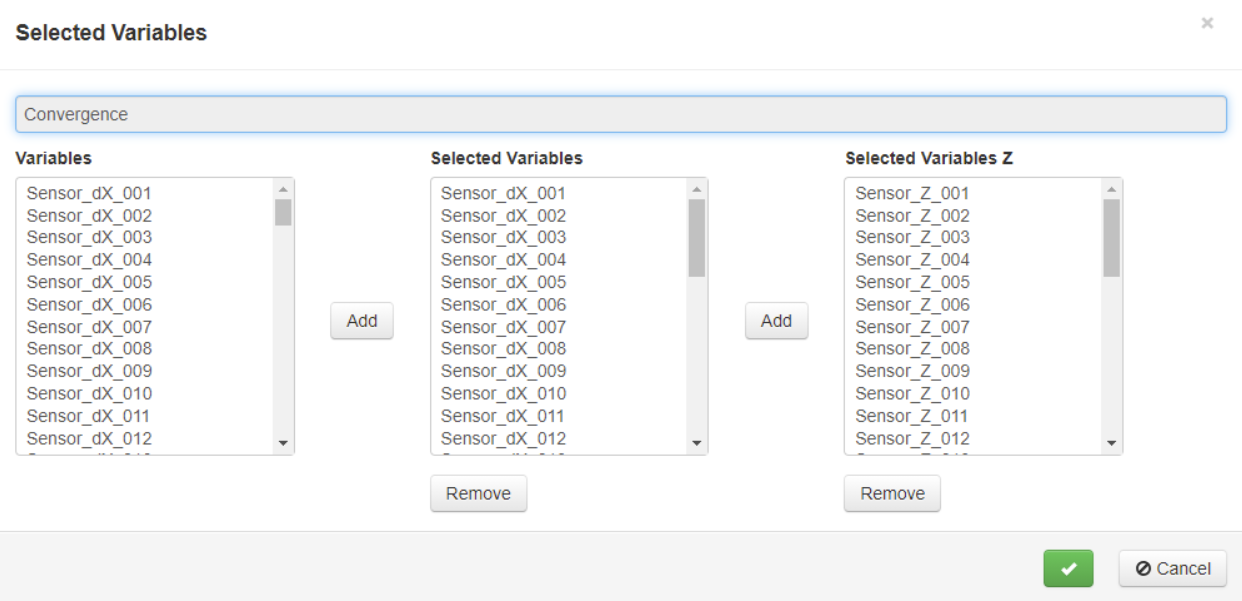
When selecting variables for Convergence, it is required to select both dX and Z. The number of dX and Z must match and be in ascending order.
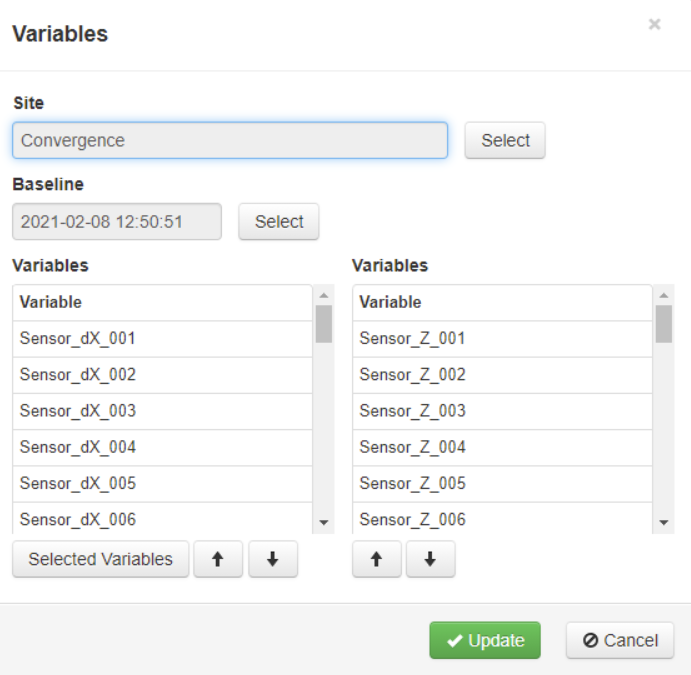
Now it is possible to move variables up or down if required.
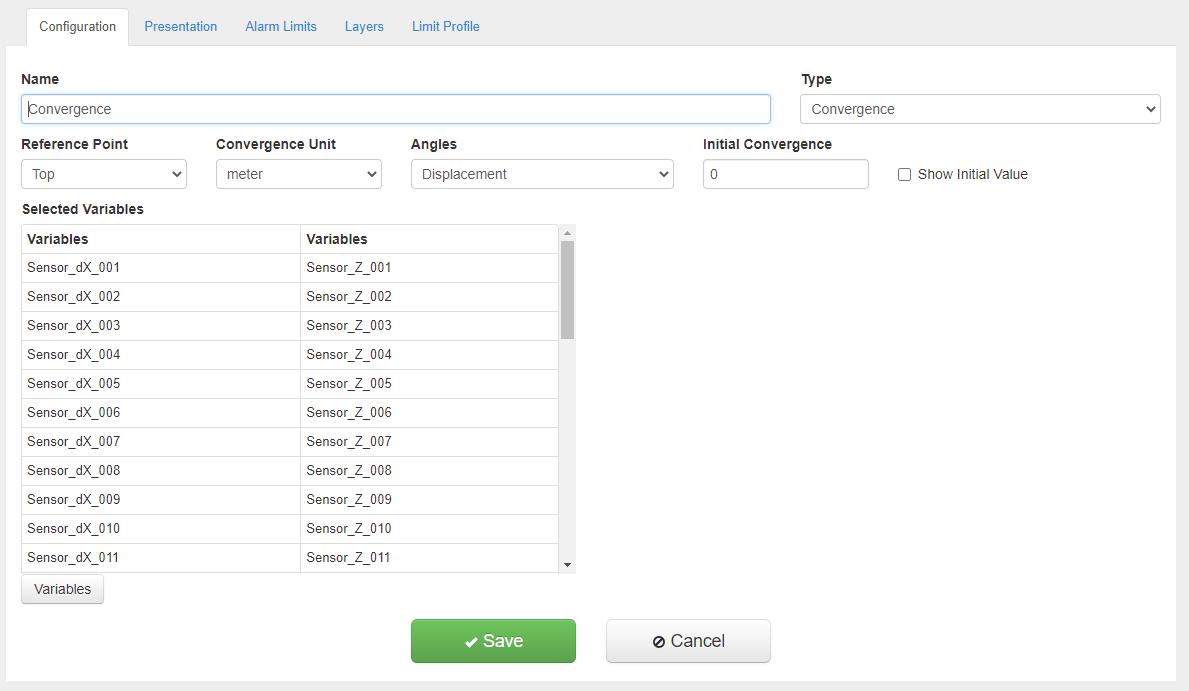
To finish the setup, select the presentation tab.
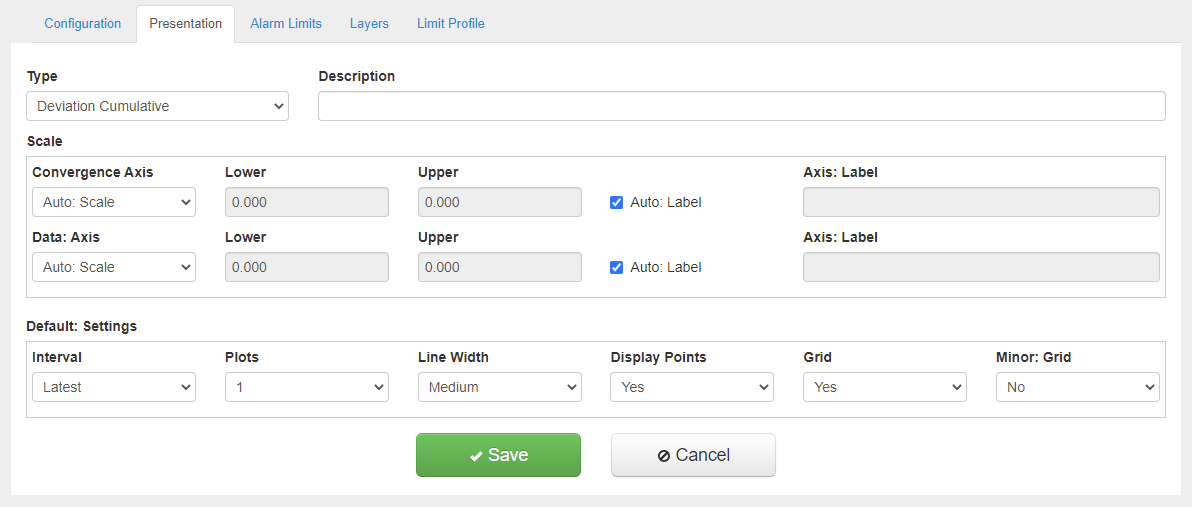
Select the presentation type as Deviation Cumulative to finish the setup.
Viewing
To view Displacement graphs, go to Displacement Graph in the left-hand menu in VDV.
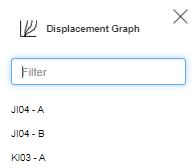
Select what graph you want to view in the list.
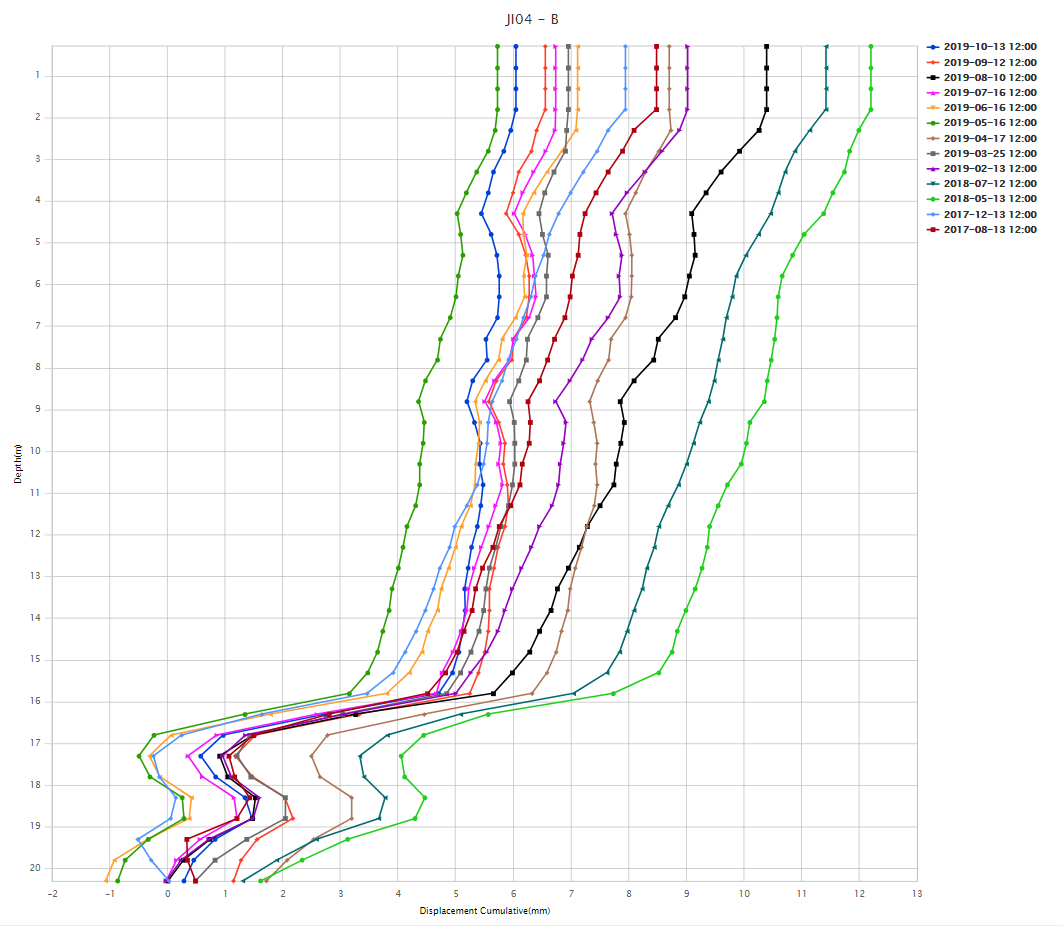
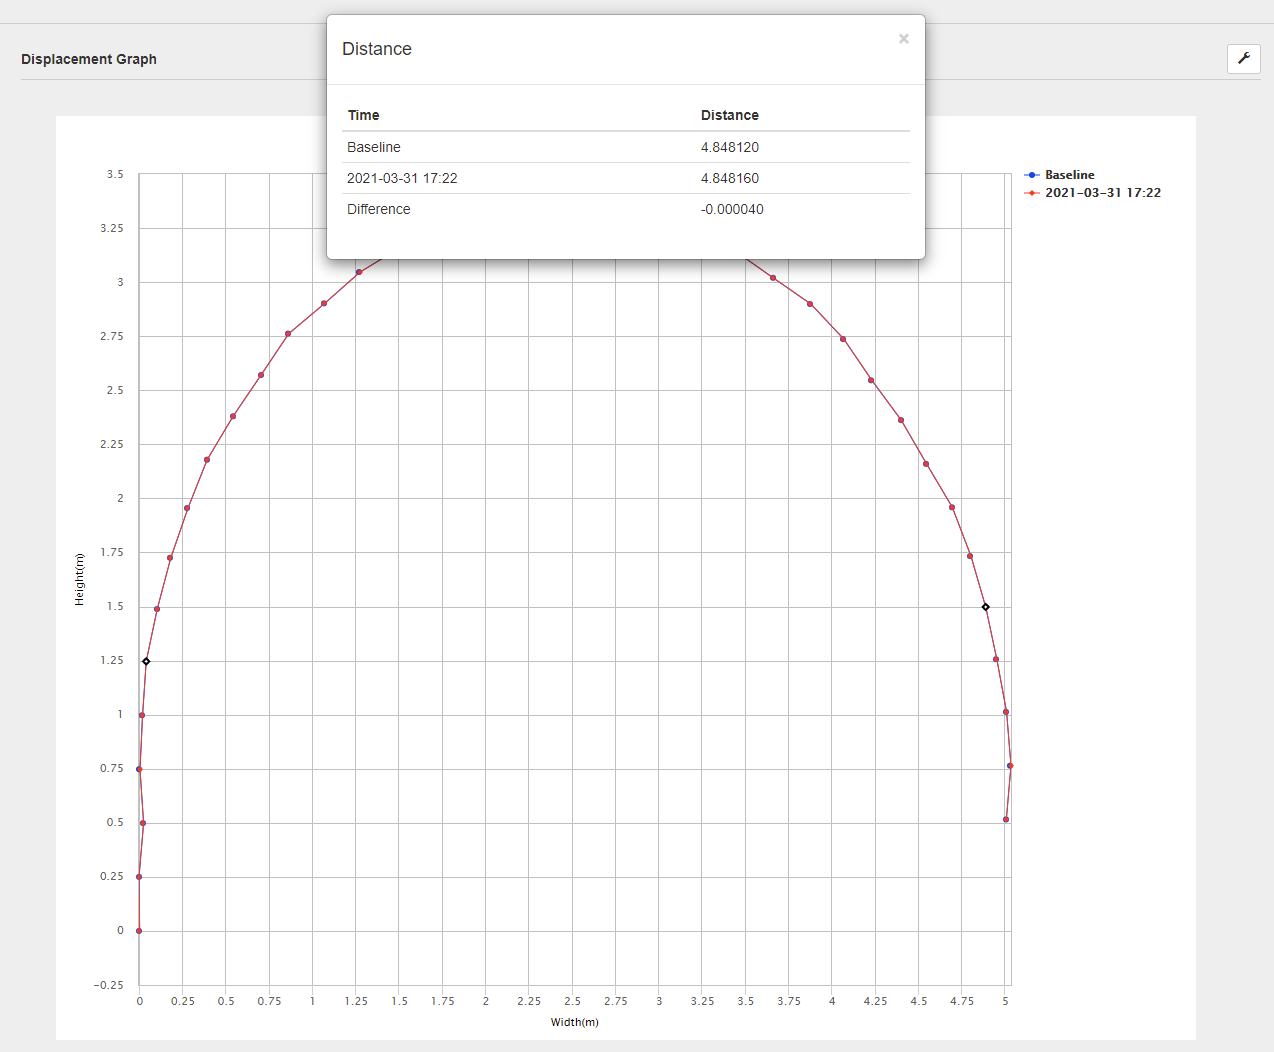
Convergence
When viewing Convergence graphs, the baseline is always visible.
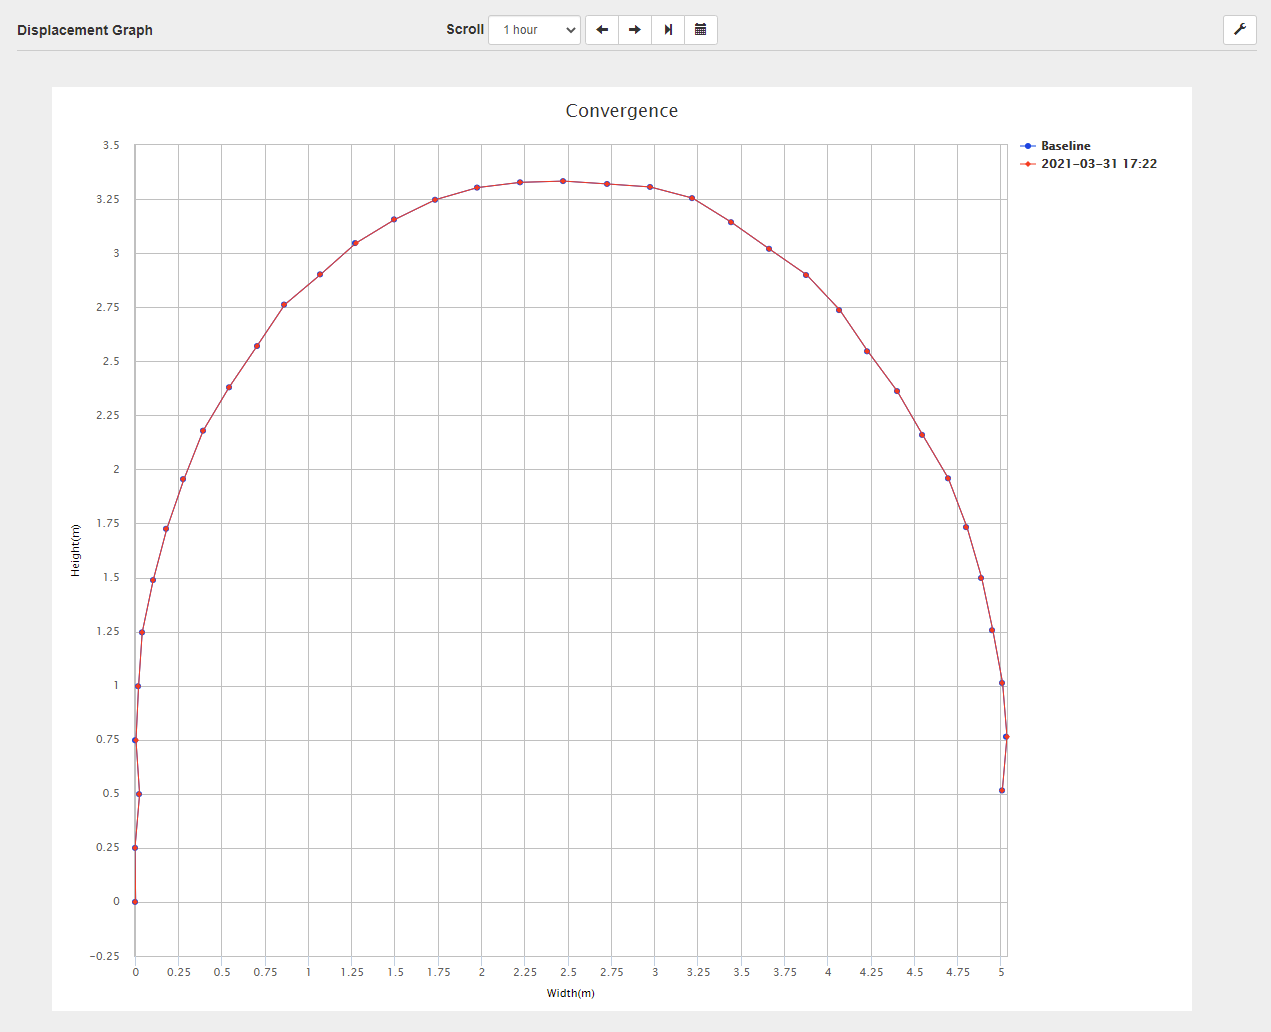
Click any two points to calculate the distance between them and compare the distance to the baseline.