Manual
Alarm
Burst Data
Dashboard
Data Source
Manual Inclinometer
Loadsensing
Ackcio
CSI
File Import
Geokon
SAA
Sigicom
Total Stations
Waste Management
Profound
Axilog
GSS
Webcam import
Displacement Graph
GIS
Historical Graphs
Real Time Display
Virtual Variables
SSO
Setup Azure AD for VDV
Setup Single Sign-On in VDV
Single Sign-On setup checklist
Manual provider setup
Analysis
API
Contacts
Contact Groups
Completeness
Data Export Task
Documents
Download Data
Localization
Notes
Month Overview
Reports
Site Setup
QA/QC
Project
Prism
Update Overview
Users in VDV
Manual Import
Setting up a webcam
Embed API
Webcam
User interface
License Overview
Graph Configuration
Site Map
Quick View
Videos
Guides
After install action list
Install VDV on-premise
Creating a new project
Installing scheduled tasks
Restarting the Vista Data Vision System
Exporting site and unit lists from db.robot.c
Exporting the settings from the File Converter
Muting sounds in VDV
Updating VDV with the store in offline mode
Migrate/Move Vista Data Vision to a new server
FAQ
Server Side
File Converter gets empty
Update header - new sensors added to the data file
Import modified or historical data
The VI Not Executable
Email subject contains information from the mail server
Webcam not importing pictures
How to configure Text Message Service
Run tasks minimized
Units
System Requirements
Backing up VDV
Front end
How to extend VDV Timeout
System validation after PHP 8 update
- All Categories
- Manual
- Prism
Prism
The Prism component in VDV allows users to define prisms by selecting its North, East and Height variables. VDV will then automatically calculate all related values on the fly. Prisms can then be viewed in a dedicated Prism Viewer and added to GIS.
Viewing
To view Prisms navigate to ![]() on the left-hand side menu in VDV.
on the left-hand side menu in VDV.
On the right-hand side of VDV a settings window will open up.
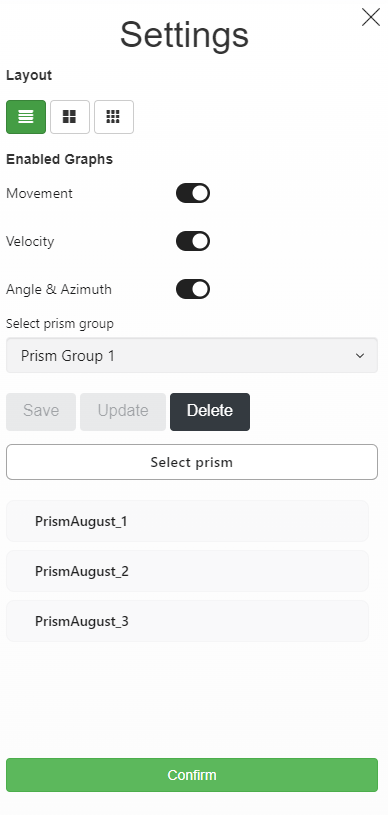
Select what Prisms/PrismGroup to Display, the layout and the enabled graphs to display, and click confirm.
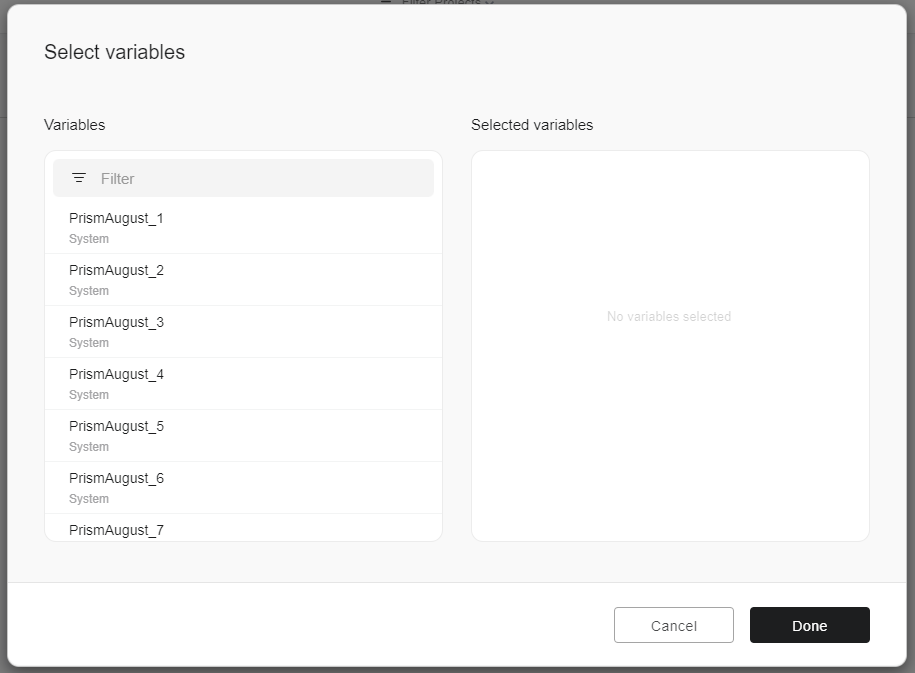
To select prisms click on 'Select prism' button, below popup will be shown up. Select prisms to display on viewer or to add those to create a new prism group.
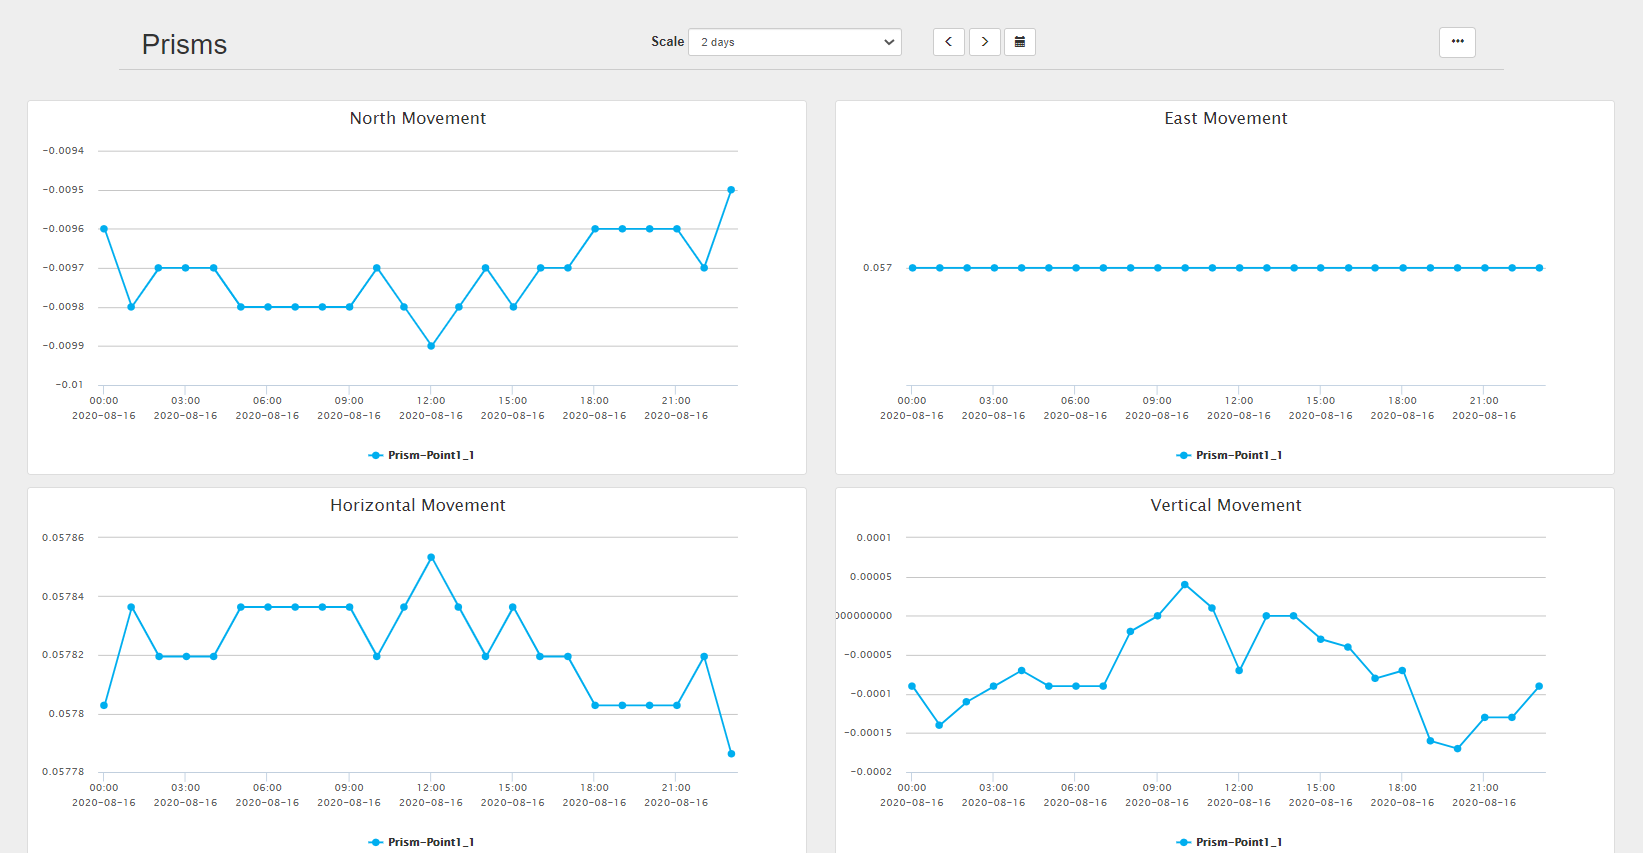
Each graph represents one movement/analysis and variables can be toggled on and off if the user selects to display multiple prisms but wants to take a closer look at one type of movement/analysis of the specific variable.
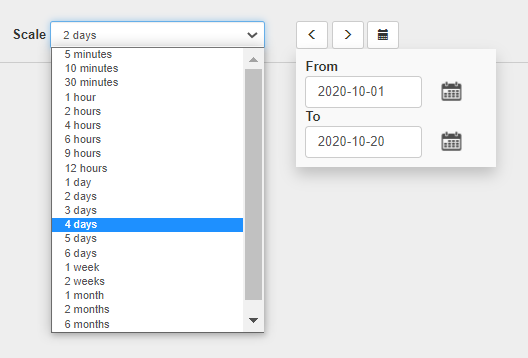
Select the scale needed either with the drop-down menu or by using the date picker as shown above.
Configuring
To set up Prisms navigate to Settings -> Prisms in the left-hand side menu in VDV.
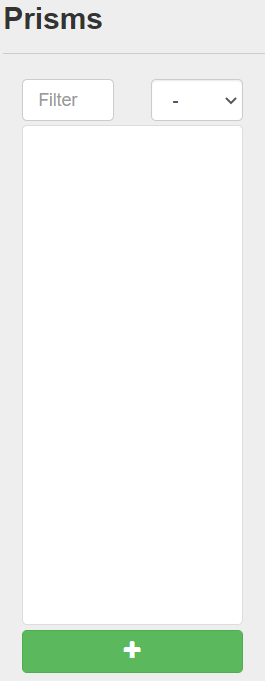
Under the + sign you can search through your sites to set up a new Prism.
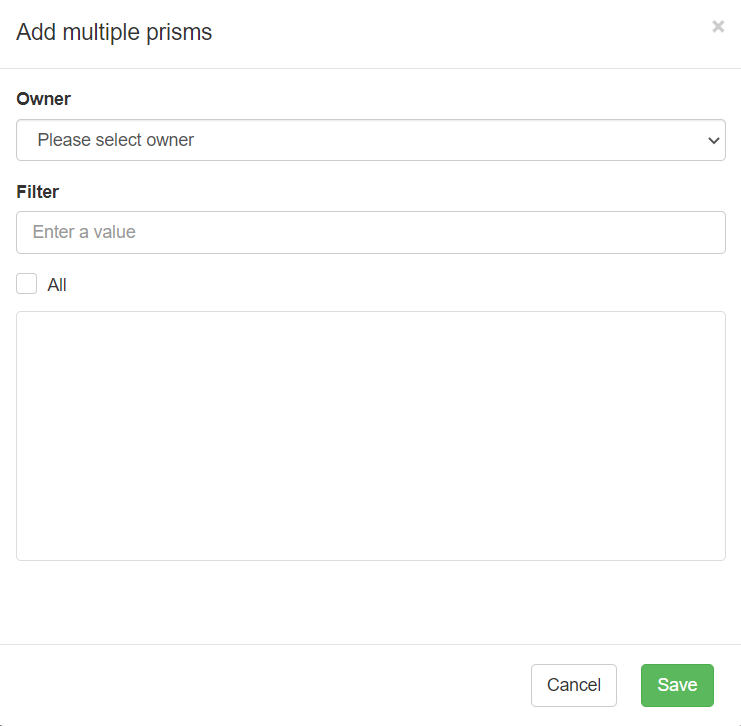
Select an owner from the drop-down list and all sites corresponding to that owner should appear in the list below. The Filter can be a useful tool in larger systems.
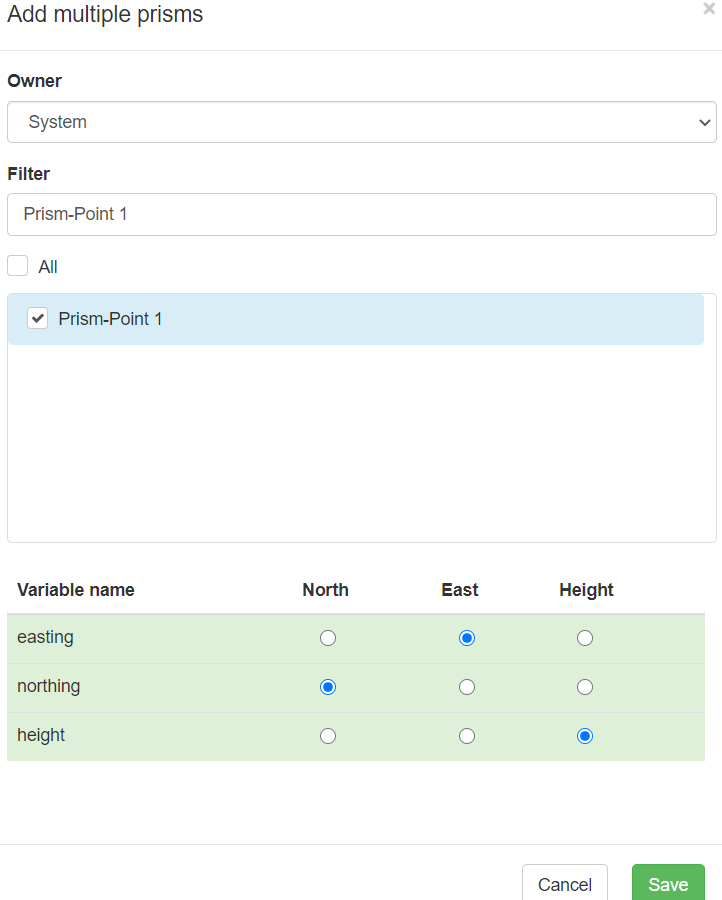
Select the corresponding variable to North/East/Height and click Save.
When importing prims data in individual data files it is possible to define multiple prisms simultaneously. Select all Sites in the site list that have the same prism definition. Select the North, East, and Height variable, and VDV will automatically use those variable names in all selected Sites to generate prisms.
After defining prisms they can be further configured.
By default, the generated prisms will have the same name as the Site they were created from. Type in a new name to customize it.
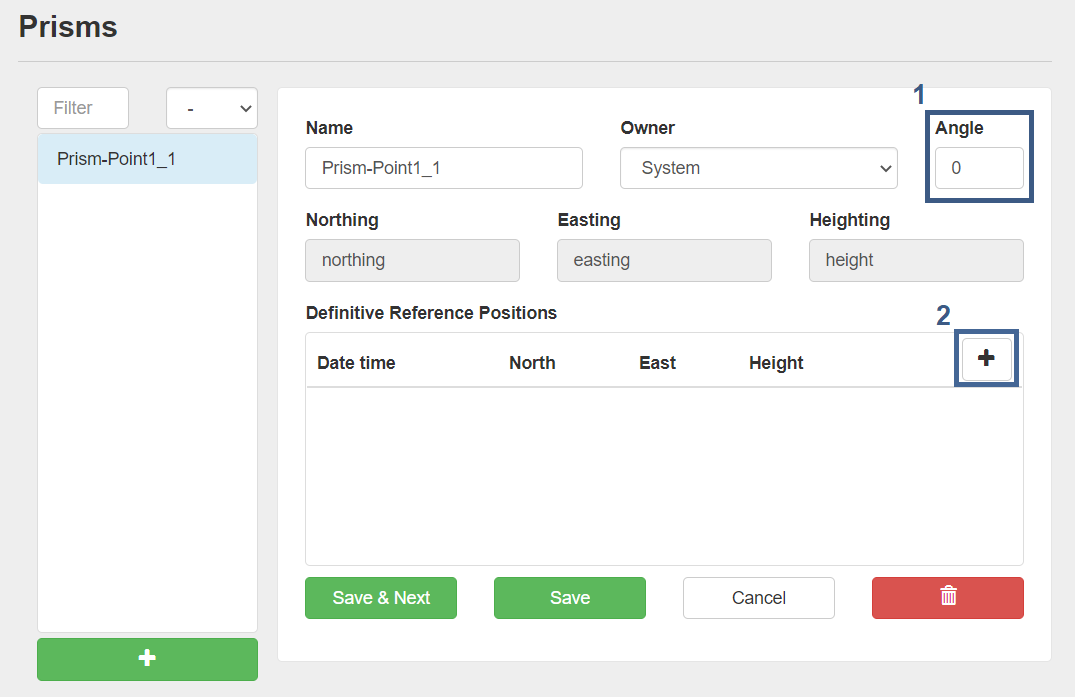
- Adjust the angle of the Prism if needed.
- To add a definitive reference position click on the plus sign
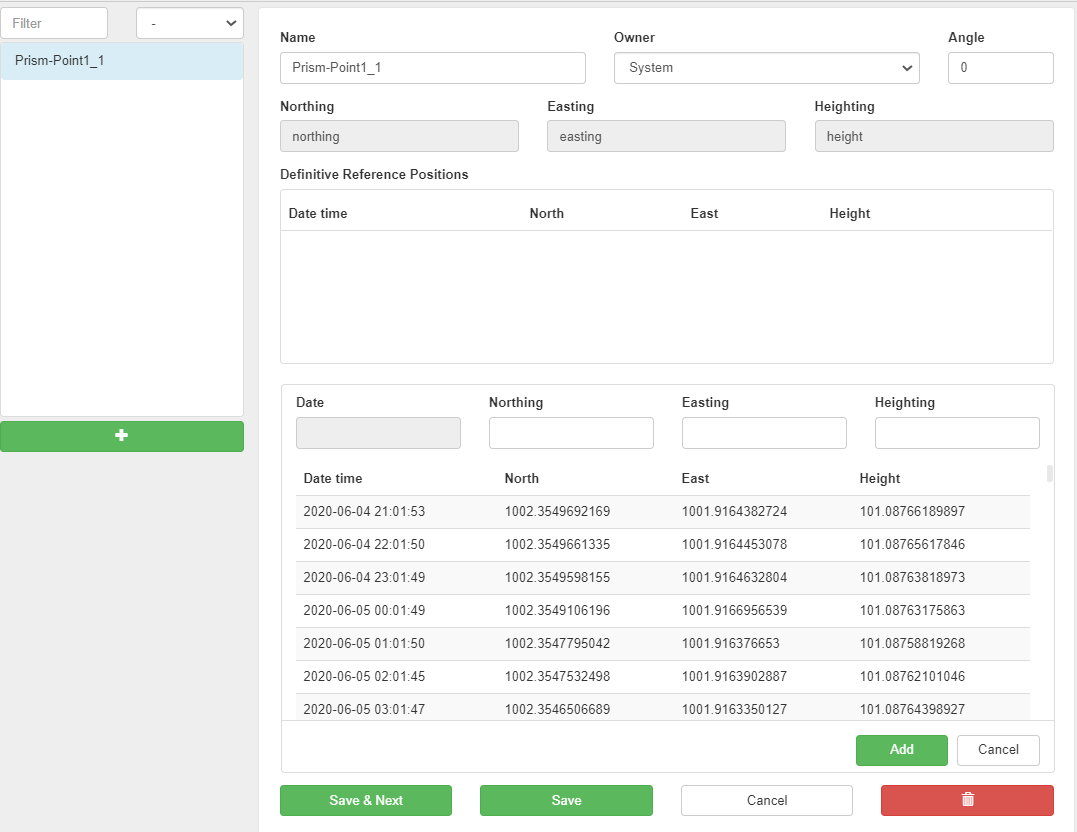
Select the definitive reference point, click Add, and finally save the Prism.