Table of Contents
Real Time Display Setup
Updated
by Ragnar Tryggvason
To Access: Setup -> Real Time Display
 button
Create a new RTD
Click on the + icon in the top right corner to add a new Real Time Display.
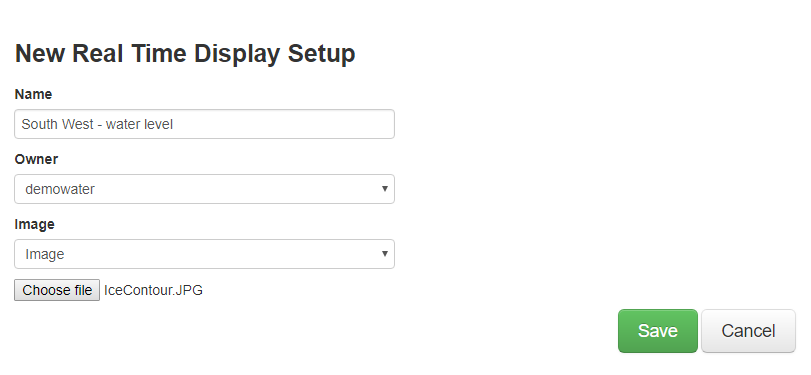
Give the RTD a name, select the Owner and select a background image for the RTD.
General
In the general menu, the settings for the RTD are configured, such as font size, colors, and if alarms should be displayed or not.
Popup Graph: Select the default period to show on a popup graph when a value is clicked.
Latest Non-NaN Value: If selected, the NaN values will not be shown but instead the last valid value.
Description: A description of the RTD. Alternatively, a Text Indicator (Indicators -> Text) can be used, allowing more options such as HTML coding and links to external websites.
Data Groups Configurations
- Display: Alarm Status will show green, yellow, and red background colors in the data groups depending on the current alarm limit. If no alarm has been configured, the background will be white.
- Show Data Groups as Box with Popup Information will change the data groups to a box that can be hovered to show the data group. The box will be green, yellow, or red, depending on the current alarm status. This is helpful when multiple data groups are on the RTD, as it clears up space.
- Show Wind Direction as Letters will change all wind directions from ° and display letters instead. Unit ° must be selected for the variable.
- Data Precision will update the RTD to show desired precision.
The rest of the configuration is to modify the layout of the data groups. Change the background color, change font size, change border color etc.
Data Groups
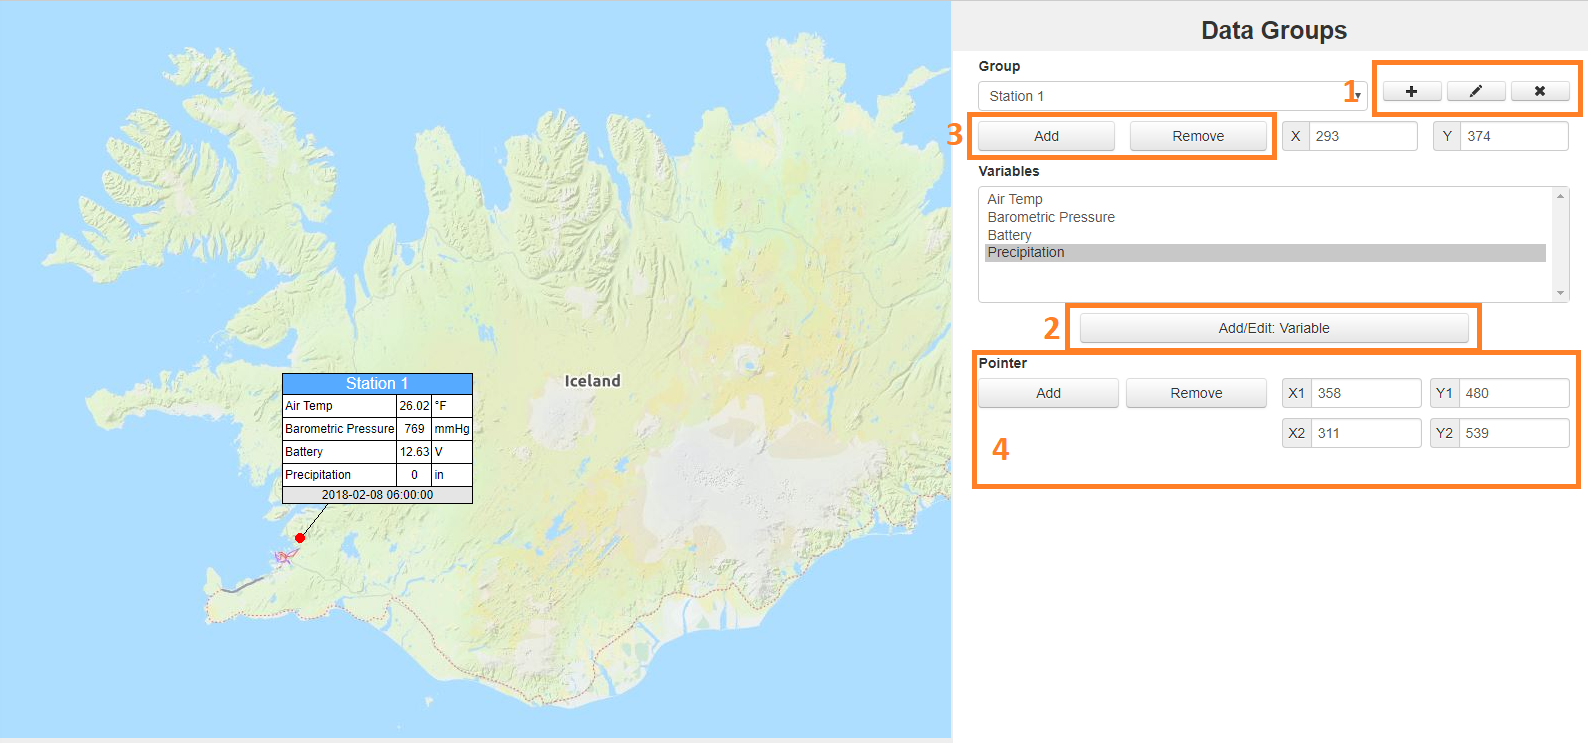
Multiple data groups can be added to a single RTD. To add a new data group, do the following:
- Click + icon to create a new data group. The other two buttons are to edit and delete the data group.
- Add variables to the data group. Note that data from different sources can be added to the data group.
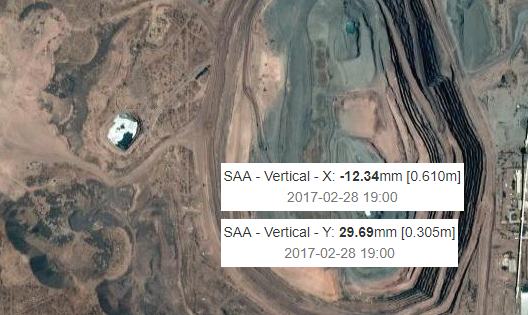
- Click the Add button, then click on the RTD to place the data group. Use the x and y coordinates to fine-tune the data group position.
- Optionally a pointer can be added, pointing to where the station is located. Click on Add, then click on the data group, and then where the pointer should point to (where the red dot is placed).
Contour
Add a layer on top of the RTD that shows the distribution of the values. A few examples are temperature distribution, air quality, and water level.
The video below shows how to use the Contour feature.
Indicators
Multiple indicators can be added to the RTD in the Indicator menu.
Alarm Table
Add an alarm table to the RTD, which shows the alarm status for selected variables.

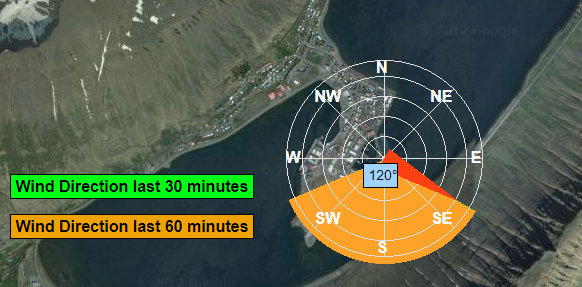
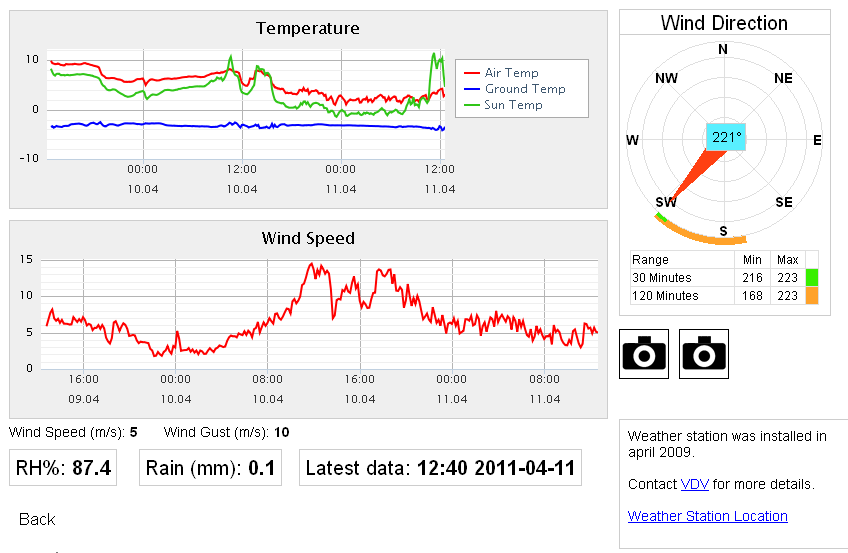
Compass
Show wind direction on a compass. It's possible to remove the background and show the wind direction span (the wind direction for the past x minutes)
Graph
Add a graph to the RTD, customizable with legend, different colors, size, etc.
Displacement Graph
Add an embedded or a popup graph showing a displacement graph. If configured as a popup graph, the maximum displacement with the depth of maximum displacement will be displayed.
Numeric
Add a numeric indicator to the RTD. The indicator can be customized with size and background color. This is great to highlight an important value.
Timestamp
Shows the latest timestamp of a specific site in VDV. If multiple data groups on the RTD are from the same site, they will all have the same timestamp. It is good practice is to hide the timestamp in the data groups and add a single timestamp indicator to the RTD instead.
Text
Create a custom text field to add to the RTD. This can be information about the project or contact information. Users can add limited HTML tags to customize the look. Only bold and underline is supported. All other HTML tags are removed.
- Add a link(only https): [VDV Bentley](https://www.infrastructureiot.com/)
- Bold text: <strong>Text in bold</strong>
- Underline text: <u>Underlined text</u>
Navigation
In the Navigation menu, it's possible to add buttons that lead to other RTDs.
This is very useful if there is an overview RTD for the project and a detailed view of a specific part of the project.
If Display Alarm is selected, the button will change to yellow or red if there is any variable on the linked RTD with a yellow or red alarm. This can be used for a quick overview of other RTDs' alarm status.
This can give an excellent overview of the current alarm status of connected RTDs.

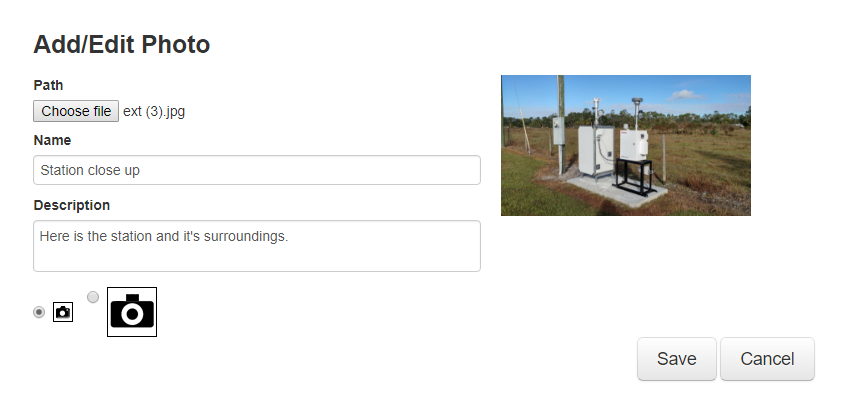
Photos
Add photos or a webcam to the RTD to give more information on the project. These can be pictures of the installation or the surroundings to provide insight for users viewing the RTD.