Manual
Alarm
Burst Data
Dashboard
Data Source
Manual Inclinometer
Loadsensing
Ackcio
CSI
File Import
Geokon
SAA
Sigicom
Total Stations
Waste Management
Profound
Axilog
GSS
Webcam import
Displacement Graph
GIS
Historical Graphs
Real Time Display
Virtual Variables
SSO
Setup Azure AD for VDV
Setup Single Sign-On in VDV
Single Sign-On setup checklist
Manual provider setup
Analysis
API
Contacts
Contact Groups
Completeness
Data Export Task
Documents
Download Data
Localization
Notes
Month Overview
Reports
Site Setup
QA/QC
Project
Prism
Update Overview
Users in VDV
Manual Import
Setting up a webcam
Embed API
Webcam
User interface
License Overview
Graph Configuration
Site Map
Quick View
Videos
Guides
After install action list
Install VDV on-premise
Creating a new project
Installing scheduled tasks
Restarting the Vista Data Vision System
Exporting site and unit lists from db.robot.c
Exporting the settings from the File Converter
Muting sounds in VDV
Updating VDV with the store in offline mode
Migrate/Move Vista Data Vision to a new server
FAQ
Server Side
File Converter gets empty
Update header - new sensors added to the data file
Import modified or historical data
The VI Not Executable
Email subject contains information from the mail server
Webcam not importing pictures
How to configure Text Message Service
Run tasks minimized
Units
System Requirements
Backing up VDV
Front end
How to extend VDV Timeout
System validation after PHP 8 update
Table of Contents
- All Categories
- Manual
- GIS
- Cross Sections
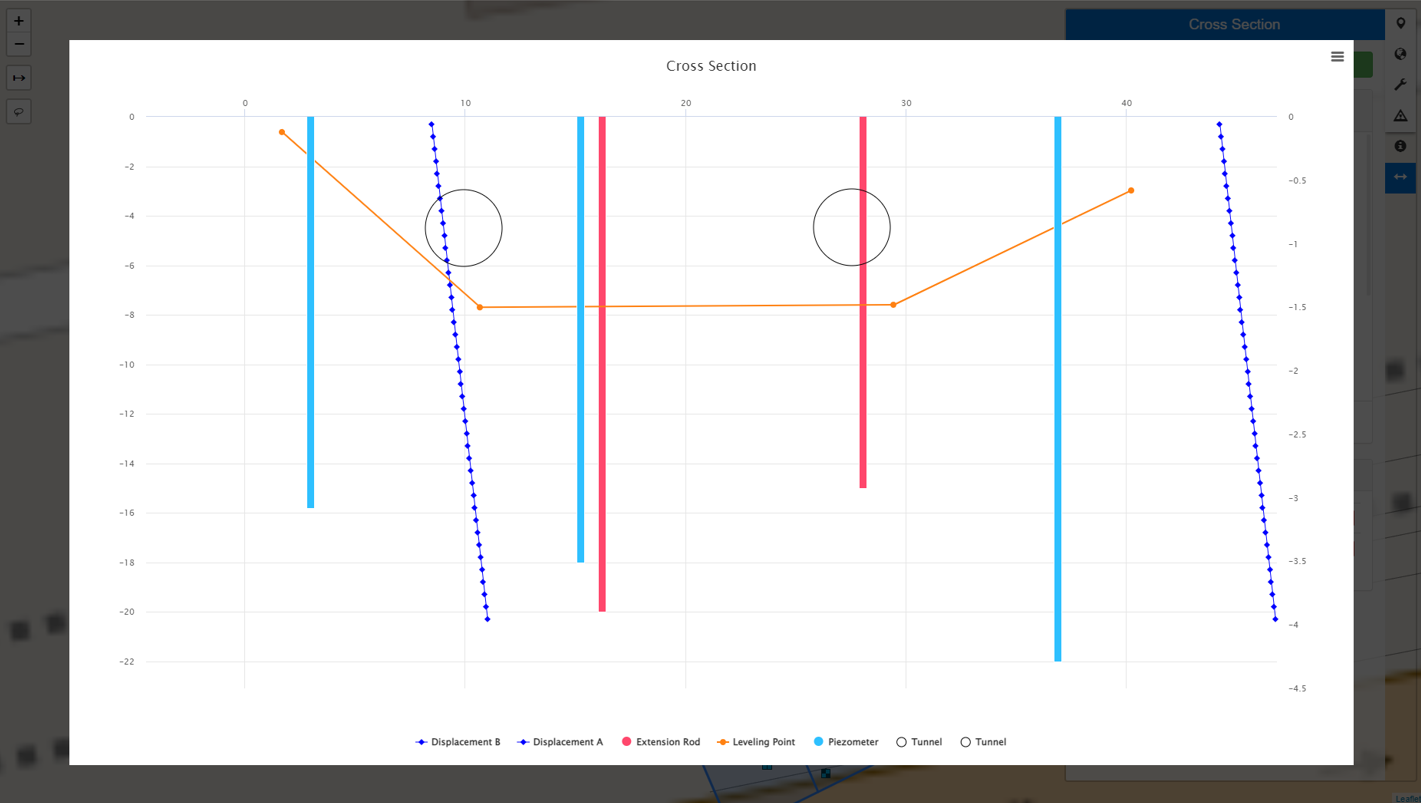
Cross Sections
Cross sections have been added as a licensed option into GIS in VDV
Setup
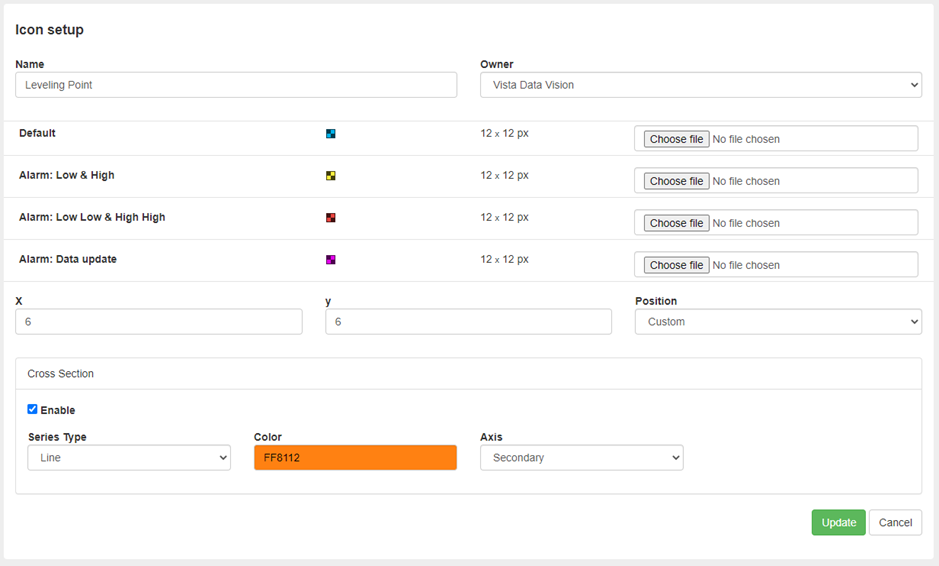
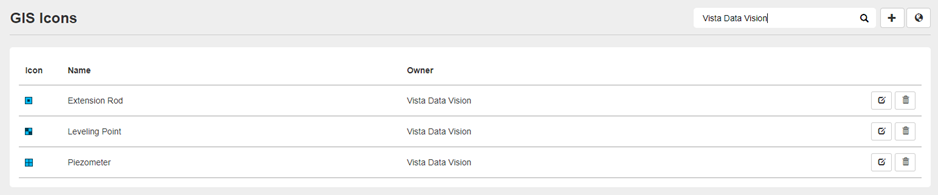
Cross Section icon
Create a Cross-Section Icon like any other icon and enable the Cross-Section feature.
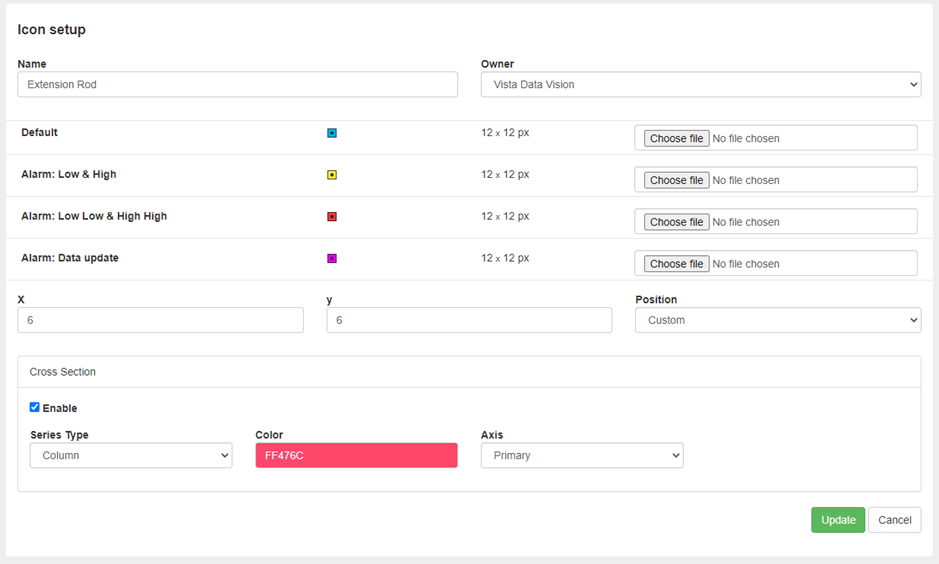
Select Series Type, Colour, and Axis.
When an icon that has Cross-Section enabled is selected in the GIS setup it will be included in the Cross Section graph.
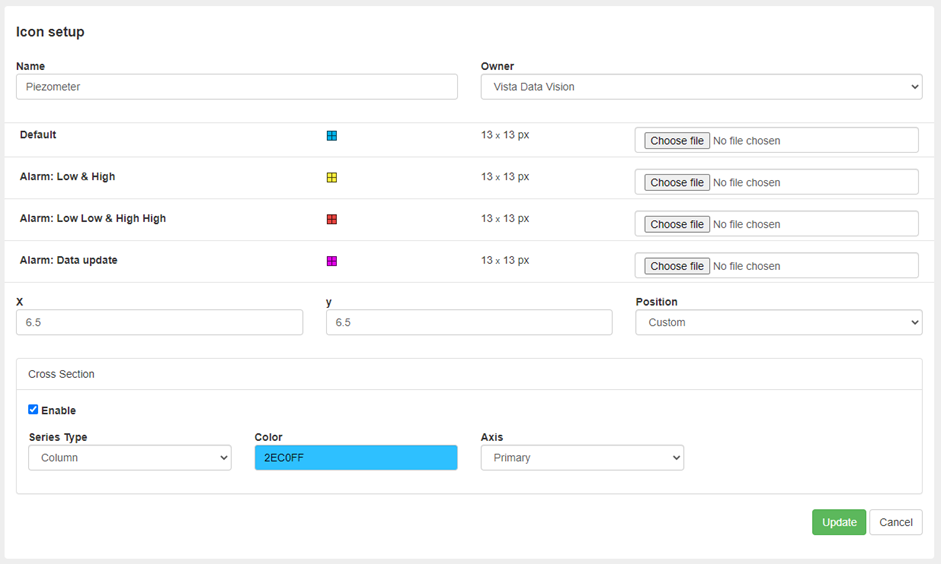
Below are examples of the Icon setup for Leveling point and the piezometer.
GIS map Setup
In the GIS Setup make sure the Cross-Section is enabled so that all CS data and graphs will be visible in the GIS View.
Layers
Now it is time to add items to create the Cross-Section. Navigate to the Layers menu and click the + Layer button and add a tunnel layer.
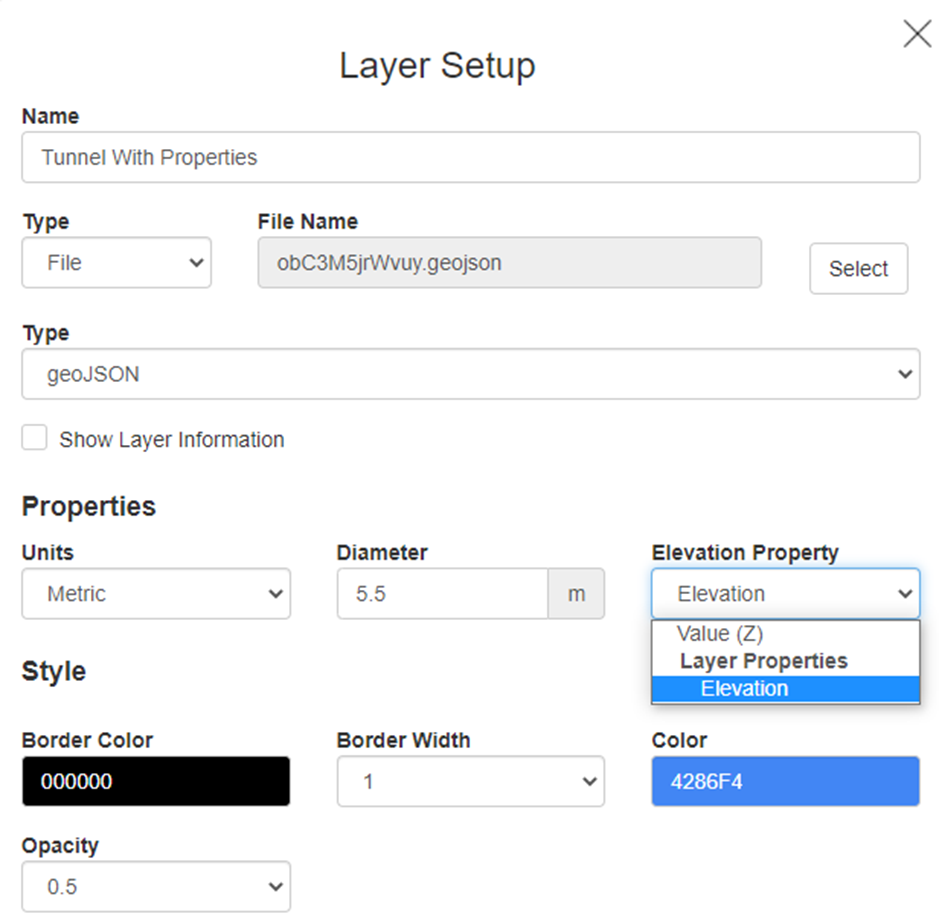
The tunnel layer menu opens and has the following properties.
Units: Metric or Imperial, depth of tunnel in eighter.
Diameter: Tunnel diameter
Elevation Property: The tunnel depth in the layer can eighter be a Z value or a feature property in the layer file.
Choose the style of the map itself: Border Colour, Border Width, Colour, Opacity.
Markers
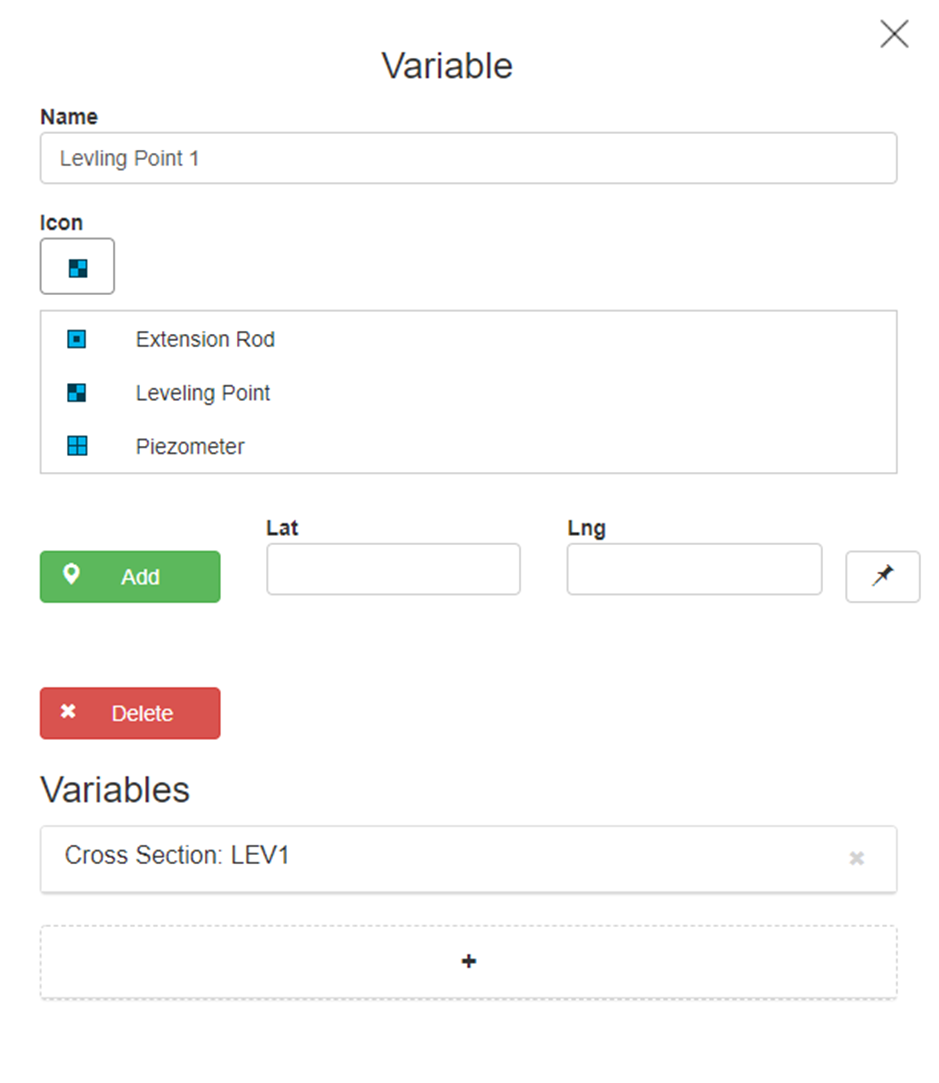
Next, add data to the Cross-Section by going to the Marker menu
Select Variable and an Icon that suites that data for all the markers needed for the Cross-Section and add them to the GIS Map.
View
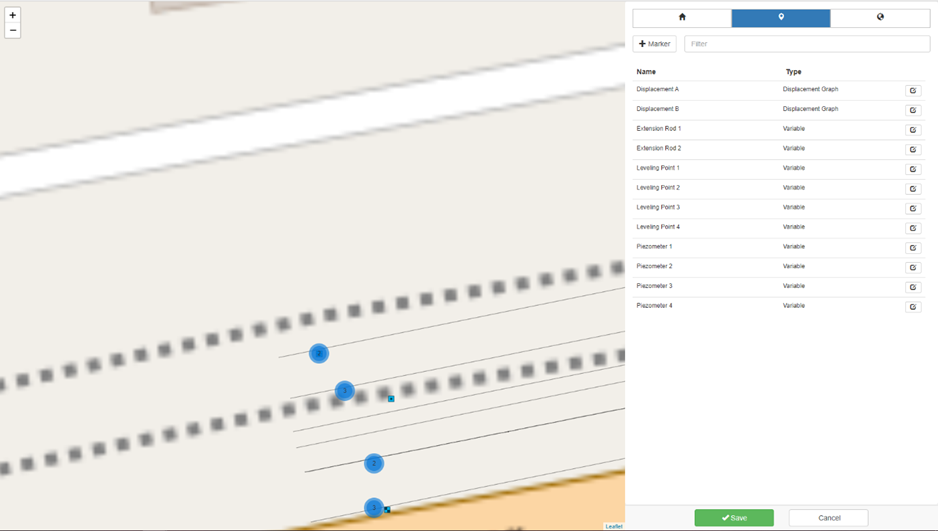
If the Cross-Section is enabled that will be an icon visible in the view.
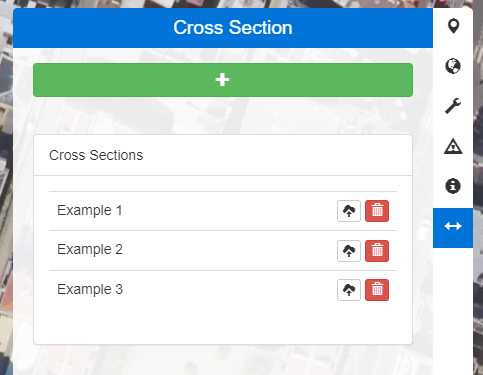
The Cross-Section menu will expand and from there it's possible to create a new Cross-Section or load existing ones.
Click the green + icon to create a new Cross-Section, then click the map to draw a straight line between 2 points. Select radius and all the markers inside the bounding box are included in that Cross-Section.
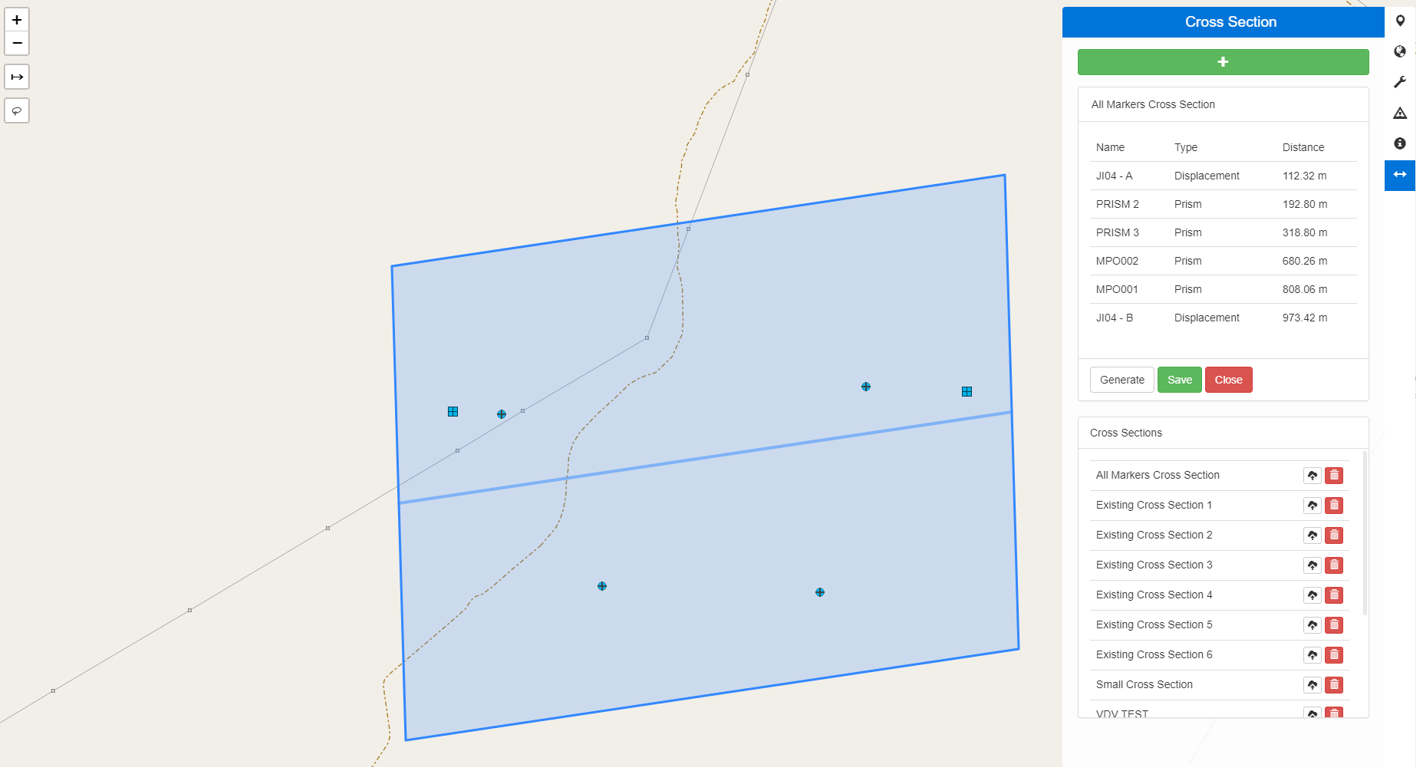
Then simply click generate and a Cross-Section Graph pops up.