Connection to db.web.browser was interrupted.Server does not reply. Please try later.
Changing TCP Port
If this is the error you see when trying to view Historical Data in VDV then you need to change the TCP/IP port db.web.browser uses. Addi hva
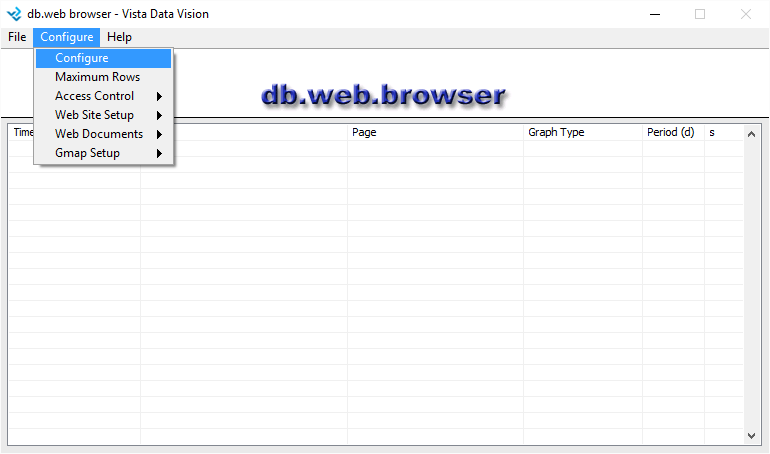
Go to db.web.browser->Configure->Configure
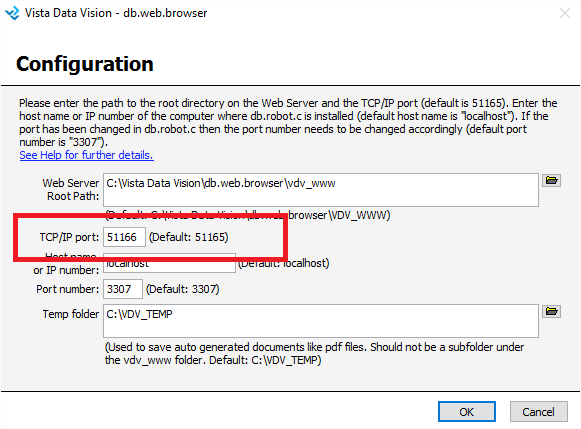
Change the TCP/IP port to a different number. For example 51166
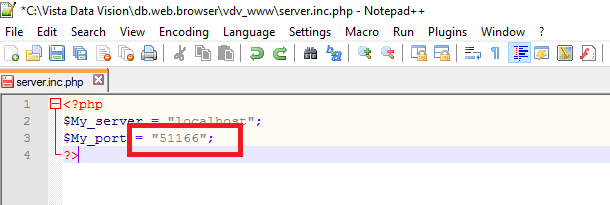
Finally you need to edit \Vista Data Vision\db.web.browser\vdv_www\server.inc.php and change $My_port to the same number.NOTE: In VDV 2018 the server.inc.php is located at \Vista Data Vision\db.web.browser\vdv_www\components\vdv\core\view and it is possible that the file is scrambled then simply copy paste the following in the file to update the port (make a copy of the server.inc.php before just in case): <?php $My_server = "localhost"; $My_port = 51165; ?>
Fix to minimize this error
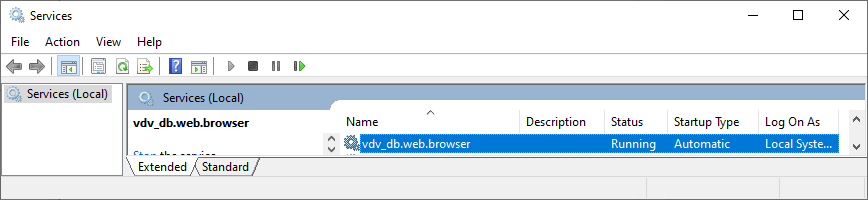
Locate vdv_db.web.browser in Services. Right Click and select Properties (First follow earlier instructions and make sure Historical Graphs are working as they should):
Set up delayed start on the db.web.browser service